L.K. Nordell, USA
Summary
The 20 km Channar overland belt conveyor system in Western Australia set new standards for low rolling resistance. The conveyor circuit consists of one 10.3 km overland with a 9 km horizontal curve radius extending over a 4 km arc, as presented in Fig. 1, and one 10.1 km straight overland conveyor. Extensive testing was allowed during commissioning to verify many design aspects of interest. Extremely low power consumption was measured. A DIN friction factor = 0.0098 [6] was recorded on the straight conveyor, and f= 0.0110 on the horizontally curved conveyor. These values challenged the basis of the existing standards which govern the design criteria of modem conveyors. This paper presents the argument for change, from present standards ([4], [5], [6] to a power equation based on viscoelastic and viscoplastic theory for systems where the difference has a significant impact on the capital and operating costs. The paper further compares the calculated results of dynamic tuning with field measurements, and of other points of interest implemented in the Channar design.

Fig. 1: Overland conveyor CV554 at 9km horizontal curve radius
1. Introduction
Channar is the name given a Western Australian iron ore body by the joint venture between The wholly owned subsidiary of Hamersley Holdings Ltd. and the Chinese Metallurgical Import and Export Corporation [1]. The mine is located in The Pilbara region, about 20 km east of Hamersley Irons mine in Paraburdoo. It will supply high grade iron ore to China over the next twenty years. The ore is transported from the Channar Mine to the Paraburdoo Plant along a 20.4 km overland conveyor system over hilly desert terrain. The routing is illustrated in Fig. 2. The Channar Joint Venture (CMS) commissioned Minenco Pty Ltd. of Australia to engineer the project. The author was hired by Minenco for the feasibility phase in 1987 arid, after project approval, as design Consultant for two years through commissioning in 1989. The responsibilities included providing the technology base of Conveyor Dynamics, Inc. (CDI): overland conveyor experience and mechanical component design expertise, starting and stopping control methods, dynamic analysis technology, horizontal curve engineering, idler optimization methods, belt splice technology, and our equipment specifications library.

Fig. 2: Channar 20km overland conveyor system - general project layout
2. Conveyor Basic Specifications
Two conveyers are designated CV554 and CV555. The conveyors are identical except for terrain and the 9 km horizontal curve of CV554 shown in Fig. 1, The following specifications are applicable to both conveyors.
|
Length |
10.4 km (CV554) |
|
Tonnage |
2.200t/h |
|
Speed |
4.1 m/s |
|
Belt Width |
1 050 mm |
|
Belt Strength |
ST-3000 N/mm (breaking) |
|
Belt Service |
5:0:1 |
|
Rating |
(600 N/mm - operating) |
|
Take-up |
Gravity (double reeved tower); 25 m travel allowance |
|
Temperature Range |
|
|
Power |
700kW x 3 DC-SCR motors |
|
Idlers |
178 mm diameter carry side, 152 mm diameter return side; 35 degree 3-equal roll carry, 2-roll Vee return; spacing 1.75 m carry side straight sections: 3.5 m return side |
|
Brake |
Located after take-up; rated 55 kN-m |
|
Profile |
The routing profile of CV554 is shown in Fig 3 |
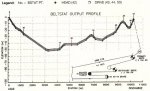
Fig. 3: Conveyor CV554 profile and drive arrangement
3. Idlers and Support Assembly
The idlers are supported with unique stringer arrangement. Instead of the conventional method, the carry rolls are fastened to a pipe.
The pipe is curved to the shape of the idler trough and is fastened to a light cold formed sheet metal stringer illustrated In Fig. 4.
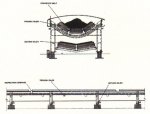
Fig. 4: Overland conveyor general arrangement - idler support structure and cover
The design offers a number of advantages:
-
Sections are light and easy to handle for faster installation.
-
Low profile provides lower wind resistance.
-
Aerodynamic design is environmentally more attractive.
-
Stronger and lighter than conventional design.
-
Low mass and high modulus yield low vibration.
-
Idler eccentric rotation pulsing, loads stringer in strong bending axis (channel cross-section) and not in the weak torsional axis of conventional frames. This minimizes sympathetic resonance between belt flap frequency, idler spin frequency, and idler support modal frequencies.
-
Operators cannot alter idler axial alignment to belt, thereby eliminating alignment errors, Methods were included to alter the alignment if major settlement occurred.
-
Instrumentation cabling runs inside stringer flange envelope, fully protected.
-
The carry side idlers can be easily accessed from underneath the hood cover (i.e., no hood cover removal is required).
The strong stringer design saves on idler life and on power by minimizing structural vibrations. A number of major conveyor installations have approached some of the attributes that make this an elegant design, such as Kennecotts Bingham Canyon 9 km overland system, which the author consulted on, and the Prosper I-land (Prosper II) ST-7500 N/mm mine slope belt. David Becktey, a design consultant to Minenco, who worked with the author over the two year period, is chiefly responsible for the Channar conveyor stringer and hood cover arrangement.
3.1 Idler Optimization
The idler selection was optimized using a CDI Net Present Value (NPV) computer program and the given knowledge of: beating loading and life, equipment capital cost, replacement cost, future manpower and costs, escalation, taxation, depreciation and the value of money. A net present value analysis was made for the 20 year mine life with the above attributes included. The idler diameter and spacing were varied for a given idler bearing size. The conveyor power and belt design were optimized for each configuration. With each bearing and idler diameter selection, a cost analysis was made versus the change in idler space. This resulted in a NPV function versus idler spacing as illustrated in Fig. 5. The plot shown is for a specific idler roll diameter and bearing set. In the design stage, we obtained representative prices for the alternatives under study. The results clearly showed that a 178 mm diameter carry side idler was superior to a 152 mm diameter. The 178 mm diameter selected reduced the power, belt strength requirements. and other sympathetic associated penalties. Theoretical analysis showed an 8% reduction in power and belt strength by using the 178 mm roll diameter. Two separate methods of calculating power based on idler roll diameter ([3], [8]). are in agreement. The bearing life, load rating, spacing, and their cost factors also pointed to a best bearing size. The carry side center roll bearing was equipped with a 6306 series ball beating, the wing rolls with a 6305 series ball bearing. The idler spacing, as shown in Fig. 5, is not unique or single valued. For Channar, the carry side spacing selection was acceptable in a range from 1.50 m to about 1.8 m. Below 1.5 m the capital costs were too high. Above 1.8 m spacing, the operating costs of power and idler replacement became unacceptable. The author is confident that greater economy would have been realized with the use of a greater idler spacing if a more accurate power equation had been used.
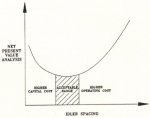
Fig 5: Net present value (NPV) vs. idler spacing
4. Power Equation
4.1 Introduction
The conveyors were engineered with the power equations developed at the University of Hannover, Germany in the mid 1960s. The work of Behrends [2] and Schwarz [3] had been adopted and modified by Conveyor Dynamics, Inc. These equations account for differences in idler roll diameter, belt lop and bottom cover thickness and rubber hardness, trough shape, belt speed, material loading, and belt tension. Many of these factors are non-linear. The equations are empirical. They are derived from experimental work. This method had proved to be more accurate than CEMA [4], ISO [5], or DIN [6] standards on many of the overlands we had worked on. During the early phase of engineering in 1988, the author informed Minenco of an alternative approach that CDI had been studying. This power equation is dependent on the rheology of rubber based on the work of Spaans [7] and Jonkers [8]. No meaningful benchmark work was known at the time to support its use. Results of Behrends and Schwarz were discussed, and it was concluded that this was the best method available. After commissioning the conveyors in December 1989, it was apparent that something was seriously wrong with the present method. The values were far below any published data or known operating conveyors from the experience of any of the engineers or consultants, The Rehrends and Schwarz power analysis method resulted in a DIN friction factor of f = 0.0164 at the lowest temperature and full tonnage. The power was calculated to be 570 kW per motor. Other Consultants, who audited the work, recommended 700 kW per motor, with a higher DIN f value based on their knowledge or experience. The larger 700 kW motor sizes and corresponding belt selection was then adopted.
The Channar overland straight conveyor CV555 draws less than 330 kW per motor with a DIN f = 0.0098, at an ambient temperature of 25C. and slightly higher on the horizontally curved conveyor CV554 with a DIN f = 0.0110. Based on these findings, the Spaans / Jonkers viscoelastic model was thoroughly developed.
4.2 Historical Background
In 1959, May. Morris and Atack [9] published a work entitled "RoIling Friction of a Hard Cylinder over a Viscoelastic Material". The "rolling friction" is the energy loss from the cylinder (idler) rolling on a viscoelastic material (belt). The model was based on the relaxation time" of viscoelastic material.
Many published works followed on cylinders rolling on viscoelastic surfaces. These works assumed cylinders of indeterminable length rolling on a viscoelastic body of infinite thickness. These works neglected the critical boundary constraints imposed by the idler and belt relationship, with its limited viscoelastic thickness and length, until Spaans [7], in 1978. published his viscoelastic studies dating from 1975. He related the loss work in the belt to its internal hysteresis from belt bending flexure on and between idlers and idler to belt rubber indentations. Jonkers later refined the work with his publication in 1980 [8]. Limberg [11], in 1988, and Greune [12], in 1989, submitted engineering doctoral dissertations on the viscoelastic theory of rolling resistance. They both made field measurements to verify the theoretical analyses. Their work is comprehensive but requires inclusion of further conditions as noted.
4.3 Overview of Present Method
All aspects of rolling resistance can now be defined using viscoelastic and viscoplastic constitutive equations. The resistance to rolling can be quantified for the ideal conditions as well as operating influences such as: misalignment of the idler system through settlement or errors in installation, belt aging, belt cover wear, differences in rubber compounds end non-rubber compounds, differences in belt carcass construction, material buildup on the idlers or belt, impregnation of the belt covers with solvents, or ore particles, polymeric covers on idler rolls, differential wear of idler surfaces, and more. The following model is developed around the work of Spaans and Jonkers. It has been further refined as noted. Spaans evaluated the indention loss, from modeling the full thickness of belt. The present theory has the compressive stress-strain zone over a smaller rubber thickness. The size of the compression or deformation zone is dependent on: a) belt rubber cover thickness and properties, b) idler diameter. c) belt flexural rigidity, d) idler trough shape. e) idler spacing, f) belt tension, g) belt speed, h) idler roll cover material, and h) special external forces due to idler alignment and vertical and horizontal curve influences.
Rubber compounds for surface conveyors have improved the rolling resistance over the earlier materials of the 1960s. Underground conveyors. with flame retardant properties, may require substantially more power due to their higher viscoelastic losses. This becomes more pronounced when the operating temperature falls below 10C and the rubber enters its "glass transition" zone. This is the region where the molecular structure of the rubber begins to crystallize.
4.4 Viscoelastic Theory
Rubber materials, like all polymers, store energy when deformed, and then as the force applied to deform the rubber is removed, the rubber recovers to its original shape. But, it will not maintain the same pressure or force on the recovery cycle as the deformation is relaxed. A stress-strain phase lag or hysteresis will occur. The principle, as it applies to belt conveyors, is illustrated in Fig. 8. The roller indents the belts bottom cover from the weight of the load. The indention or deformation is proportional to the localized compression force which varies across the idler face. As the belt moves forward, the deformation relaxes as the belt leaves the idler surface. Due to the latent time delay in the recovery action of the rubber, the strain pattern lags the stress. The lag indicates a hysteresis or energy loss. This results in torque to turn the idler roll. The amount of torque is determined by the imbalance in the symmetry of the compression forces about the idler's vertical axis. Various Laws can model this principle (Equilibrium, Energy. etc.). The concept can be observed with the analogy presented in Fig. 7.
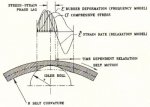
Fig. 6: Idler roll indentation into belt cover - viscoelastic compression cycle and strain phase lag
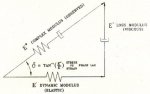
Fig. 7: Viscoelastic modulus - storage (dynamic), loss (viscous) modulus, and phase lag angle (δ)
4.4.1 Definition of Rubber Elastic Dynamic Modulus and Loss Modulus
Rubber viscoelastic properties are divided into the three elementary actions: E*. the complex modulus, E', the dynamic or storage modulus, and E", the viscous or loss modulus. When the rubber is deformed in compression, or extended in tension, we observe the complex modulus action coupling the pure spring or Hookean response E', with the energy dissipated in the belt with the viscous dashpot E". The viscoelastic stress-strain cycle are related through the phase lag angle δ . The phase angle δ, as shown in Fig. 7, couples E' and E" through δ = tan-1(E" / E'). By convention, E', E" and E* are considered in the linear viscoelastic range. They represent the frequency dependent domain of stress and strain response to a compressive or tensile loading. The idler compressive strain range is normally below 5%. With higher strain values, the rubber stress-strain characteristics may become non-linear, and the frequency dependent analogy may not provide an accurate result. A constitutive model based on relaxation time or strain rate (έ) accounts for non-linearity effects but is mathematically difficult to implement. At present, the linear viscoelastic frequency model is being used, Further research is being conducted on improvements in the viscoelastic model accuracy, dependent on higher speeds and other factors. The present E* model correlates between predicted and measured at higher than 95% for conventional systems.
4.4.2 Belt Viscoelastic Idler Indentation Losses
The viscoelastic model can presently predict the behavior of a rubber belt and rubber roller in combined deformation with reasonably accurate results. When analyzing two rubber bodies in rolling contact, the shear stress-strain deformation cycle at the idler belt interface may become significant requiring shear viscoelastic properties, G' and G" (shear dynamic modulus: loss modulus), especially if the roll surface has a variable diameter. The shear viscoelastic analogy is shown in Fig. 8. In approximate terms, the E', E" compressive cycle will alter the power by the following: The pressure or load (F) on the idler will alter the rolling resistance by (F)4/3. A change In E' (resilience) will alter the rolling resistance and power in the inverse proportion (E)1/3, as shown in Fig. 9, and the viscous or loss modulus will alter the rolling resistance and total power by the linear proportion (E") as shown in Fig. 10.
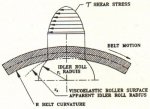
Fig. 8: Idler roll indentation into belt cover - shear viscoelastic cycle
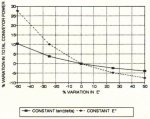
Fig. 9: Total power change (%) vs. % variation in dynamic modulus E'
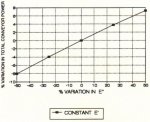
Fig. 10: Total power change (%) vs. % variation in loss modulus E"
Rubber indention loss is one of the many types of losses to be accounted for, It is usually the main loss, except for gravity forces. Some additional losses are: belt flexure hysteresis, materiel trampling hysteresis, idler alignment loss, belt axial tensile loss, and parasitic losses (idler bearings, seals, pulley bearings, scrapers and skirts, etc.).
4.4.3 Belt Flexural Loss
Flexural losses are caused by the cyclic reshaping of the belt as it passes from the idler contact through the unsupported span between idlers (Behrends [2] and Spaans [10]). The belt must conform to the idler position along its path as it moves from one idler to the next. Between idlers the belt sags like a clothes line. In the process, the belt is flexed back and forth convexing over the idlers and concaving in shape between them. On each change of shape, the rubber and steel cords or fabric tensile members are undergoing a hysteresis loss. The belt's bending stiffness, through its thickness, governs the degree of viscoelastic hysteresis (E") due to flexure. The bending stiffness also has a direct influence on the idler roll indention loss. Fabric belts have a lower bending stiffness than steel cord belts of the same strength rating. This produces a greater conformance of the belt to the idler surface, and thus a greater contact zone of rubber under deformation. The increased indentation hysteresis is reduced by the lower belt mass. Therefore, fabric belts, except straight warp Kevlar, usually will require a little more power and results in higher tensions in horizontal runs. This effect can be significant with thin low ply fabric belts.
4.4.4 Material Tramping Loss
Material trampling loss is best illustrated by Fig. 11. The belt's flexural motion also applies to the material. The material loss will be viscoplastic, as Illustrated by the dashpot analogy. Once the material has taken a shape, work is required to change it. The constant compressing of material back into the idler shape after it is relaxed to a new shape between the idlers, as it travels from idler to idler, causes a loss in compression and in relaxation. Some materials may consolidate or compact (strain-harden) with continued working or disturbance, thereby altering the dashpot properties. Trampling losses become more severe when the belt tension is relatively low, allowing for high belt sag between rolls, It is advisable, on overland systems. to keep belt sag below 1% to minimize excessive losses from trampling and dependent higher Compression and flexural losses.
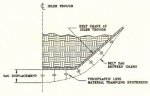
Fig. 11: Material trampling loss - viscoplastic analogy
4.4.5 Idler Alignment Loss
Idler alignment loss can be a significant loss. The installation contractor's alignment criterion usually is: does it run? If it runs without touching the steel or belt side travel switches, it's O.K. Ideal Idler alignment generates a uniform pressure distribution or rubber deformation zone on the idler roll to belt contact region, as illustrated in Fig. 12. Alterations to the alignment through idler lateral offset, as illustrated in Fig. 13, rotation, vertical offset, forward skewing, etc. produce local increases in pressure or deformation. The rolling resistance is the summation or integration of the deformation region. Recalling that fαF4/3, the net fα∫i dF(i)4/3 is for all i, as F(i) varies across the idler face. Any variation in the ideal pressure distribution will increase the rolling resistance. Skewing of the idler set or forward tilting of the wing rolls produces additional rolling resistances as previously noted. Fig. 14 shows a typical skew angle α, and Fig. 15 illustrates the potential motor power increase as a function of skew angle, and roller covering. The graph represents a 1800 mm belt transporting 9,000 t/h. The concept and magnitudes are typical for other operating conditions. Garland idlers develop higher losses running empty due to their natural 3 forward tilt.
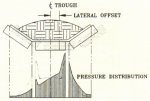
Fig. 12: Ideal rubber pressure or deformation distribution across idler face with perfect idler alignment
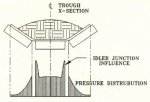
Fig. 13: Rubber pressure distribution across idler face - lateral idler offset increases local pressures
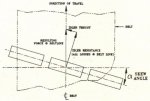
Fig. 14: Idler roll assembly skewed angle (α) from ideal alignment
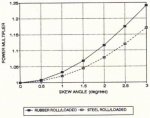
Fig. 15: Power increase vs. skew angle (α) - horizontal running conveyor 1,800 mm wide by 9,000 t/h
- comparing steel and rubber covered rollers
4.4.6 Belt Axial Tensile Loss
As the belt is elongated, the rubber body and tensile members undergo a graduated hysteresis loss in proportion to the tension and deformation differential. When the belt tension around the drive pulley drops, this loss is localized over a small section of belt. This makes up another part of the force balance mechanism.
4.5 Measuring Rubber Viscoelastic Properties
The viscoelastic properties E', E" and G', G" cannot be measured directly with any instrument. Based upon the phase angle (δ) theory, the dynamic and loss modulus are derived from the complex tensile compression modulus E* and the complex shear modulus G*. A very special, and sensitive, machine is required to measure the complex modulus and phase angle (δ) relationship between stress and strain. The machines are called Dynamic Mechanical Analyzers (DMA) or Rheometric Solids Analyzers (RSA). Rheometrics Inc., a USA-based manufacturer of rheological test equipment has trademarked the RSA term. The photographs In Fig. 16 illustrate the RSAII machine, and the dual cantilever jig used by CDI to measure the viscoelastic tensile / compression properties (E', E"). The machine runs on frictionless air bearings, controls a cryogenic chamber for large temperature sweeps, and can control strain and frequency with extreme precision. The machine vibrates a small sample of polymer in the jig. A Fast Fourier Transform (FFT) analysis is performed on the load cell measurement attached to the static side of the jig. It produced the graph shown in Fig. 17 of E', E" and tan (δ). the tangent of the phase angle for a temperature sweep of the operating range anticipated. A series of analyses are made at different strain values and frequencies. A generalized equation is then formulated for a polymeric compound. Noting that the frequency represents the rate at which the polymer is deformed (i.e., belt speed dependent parameter). The E'/E" are the principal power coefficients for rolling friction. The G'/G" become important when shear has an influence, such as with rubber idler rolls.
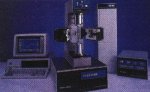
Fig. 16a: Viscoelastic measurement equipment: rheometrics solid analyzer RSAII machinery
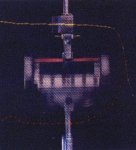
Fig. 16b: Viscoelastic measurement equipment: dual cantilever jig measuring E', E"
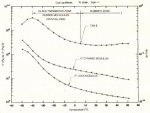
Fig. 17: Viscoelastic measurements - E', E" and tan δ vs. temperature using modified dual cantilever jig
Rheometric measurements will play an important part in studying pulley rubber lagging under the high stresses and heat loading of large drive systems. The high shear forces and surface working of belt and lagging produce heat from the viscous loss effects as with the belt.
The machines may be able to predict the properties of rubber fatigue and duress, such as: wear mechanics, splice dynamic efficiency associated with rubber strain and strain rate damage.
Commercial machines. such as the RSAII, are relatively new to the industry. New techniques, fixtures, software, and constitutive laws are expanding their use into virtually all areas where viscoelastics, viscoplastics and fluid or solid materials are used.
Viscoelastic rolling resistance analysis techniques will provide the means to assess improvements in rubber compounds. This may become significant when manufacturers provide a belt top cover for good abrasion and gouging resistance and a bottom cover for good rolling resistance characteristics, as noted by Hager [13].
4.6 Comparison of Viscoelastic Prediction with Standards and Field Measurements
The author assisted in the design and commissioning of a number of large conveyor systems in the 1980s and through the present. Accurate field instrumentation and data acquisition equipment has been developed by CDI to verity the performance and/or trouble shoot many conveyors over the last ten years. The historical data has been reviewed in light of the Channar findings. When all field parameters are mown, and are appropriately structured, the viscoelastic model accuracy is shown to be better than 95%, while typical standards can be in error by more than 80%.
Two conveyors are provided for comparisons with the present design standards: Channar and Kennecott's Bingham Canyon overland system. The author assisted in the design and commissioning, and field data acquisition, of both systems. From the field data, the DIN rolling resistance (f) was calculated at known material loading, power reading, speed and temperature. Table 1 shows the comparison between measured DIN f, CDI's viscoelastic prediction, and the values developed from CEMA and DIN 22101. Note, the same idler bearing and seal values were held for alt cases.
|
Project |
DIN 22101 Equivalent Friction (f) |
||||||
|
Actual |
CDI |
% |
CEMA (2) |
% |
DIN (3) |
% |
|
|
9,100 t/h |
0.0144 |
0.0145 |
1 |
0.0176 |
22 |
0.210 |
46 |
|
2,200 t/h |
0.0109 0.0098 |
0.0105 (curve) 10.3km 0.0098 (straight) 10.1km |
4 0 |
0.0179 0.0179 |
77 83 |
0.0179 0.0179 |
77 83 |
5. Dynamic Tuning
The individual conveyors were dynamically analyzed using the BELTFLEX [14] computer program. 'The elastic response during starting and stopping was engineered to be compatible with the low belt service factor (Belt Safety Factor) of 5:1.
5.1 Starting
The starting sequence was divided into two control categories: a) steady-state strain, and b) acceleration. The steady-state strain is defined to be the belt's steady-state or running operation condition, where the belt tensions have stabilized at a steady belt speed. The conveyor was brought tsp to about 5% speed in 10 seconds. The speed was held steady for 20 seconds. After 30 seconds elapsed, the acceleration ramp brought the conveyor to full speed in 190 seconds. This is illustrated in Fig. 18 and Fig. 19, In Fig. 19, the effect of the dwell period can be observed. In the first 30 seconds, belt slack is pulled out and at masses are brought to close to running conditions, This eliminates overstressing of the belt that would otherwise be produced by the large initial error in the proportional-integral-derivative (PID) control loop [16]. This method is estimated to reduce peak belt tension by about 15%.
The theoretical analyses are in good agreement with the field measurements. A faster acceleration cycle could be used in light of the reduced power demand, but this has not been implemented.
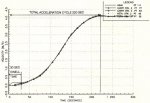
Fig. 18: Speed vs. time acceleration ramp - Channar conveyor CV554 with 30 second dwell period and 190 second acceleration ramp
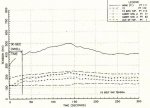
Fig. 19: Tension vs. time acceleration ramp on CV554 with 30 second dwell period and 190 second acceleration ramp
5.2 Stopping
During the early phase of the stopping cycle, with a loaded conveyor, belt gathers (sags) between the idlers along a 4 km zone, starting about one km from the tail station. The profile is shown in Fig. 3.
The slack belt is drawn from the belt take-up storage area. A large shock impulse is generated by the counterweight when the belt slack is eliminated during the last phase of the stopping cycle. As the belt's forward motion is stopped, the counterweight gradually pulls out the slack belt. When sufficient stack is generated, it allows the counterweight and the belt engaged in motion, between the slack zone and the counterweight, to gain momentum before the sag is reduced to near zero. At near zero, a larger shook wave is developed, as shown from the field measurements in Figs. 20 and 21. The theoretical tension calculations are in agreement, as shown in Fig. 22. The illustrated data is after dynamic tuning had been applied through the use of flywheels. Without dynamic tuning, the belt sag and shock effect would be much greater. Or worse yet, the take-up assembly would travel a much greater distance, or produce a high impact force on Its structure after exhaustion of available travel. A sensitivity study was made on flywheel sizes, take-up travel, and their attending tradeoffs, with costs, design complexity, etc., including starting consequences. The study was performed with the BELTFLEX program.
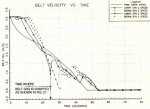
Fig. 20: Belt velocity vs. time - stopping conveyor CV554 fully loaded. Conveyor with 600 kg/m² flywheel mass, without brake control - field measurements.
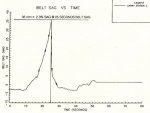
Fig. 21: Belt sag vs. time - conveyor CV554 station No. 3 carryside, 1.2 km from tail station - with 600 kg/m² flywheel mass, without brake control - field measurements
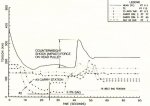
Fig. 22: Belt tension vs. time - stopping CV554 with 600 kg/m² flywheel mass, and no brake control
5.2.1 Flywheels
Both conveyors were dynamically tuned with flywheels and brakes, A screening study was made to determine the most appropriate flywheel inertia rating. The flywheel sizes studied were classified in multiples of the drive's total inertia. The combined motor and flywheel masses were evaluated over the range of 1-10 times the basic motor rotor inertia, Conveyor CV554 and CV555 were installed with a drive inertia equal to 10 times the rotor's singular Inertia. Each 700 kW motor has a flywheel assembly mounted on a jack shaft and coupled between the motor and reducer. The flywheels were cleverly divided into three Inertia groups per assembly. One disk was permanently mounted on the flywheel shaft, and two disks were designed to be removed from service, but left on the shaft. This feature allowed field tuning. After commissioning, the CV554 drive mass inertia of 8 times was selected, and on CV555 a 10 times inertia was selected, This was in agreement with the final design recommendations.
5.2.2 Brakes
Hydraulic caliper disk brakes were provided on an adjacent bend pulley after the take-up assembly. The brakes aid in reducing the belt shock due to excessive sag. The brakes main function is flow control of material at the chute transfers, The brakes eliminate overloading of the downstream conveyor. The brakes are equipped with load cells to monitor their actions.
5.2.3 Holdbacks
High speed holdbacks were installed on the gear reducers for safety reasons after the conveyor came to rest. Thermal growth between night and day conditions will cause significant motion of the drive assembly. To fully protect maintenance personnel, the counterweight had to be lowered to eliminate the pull.
6. Equipment Notes
6.1 Belt
The belt has a service rating of 5:1 (breaking strength to operating rating). To guarantee its performance. the belt splice was tested for dynamic fatigue strength at the test facilities at Hannover University, Germany. ContiTech of Germany supplied the belt and splice design. The splice tested at a dynamic efficiency of 58% for 180,000 revolutions on the Hannover machine. Special reinforcing methods were included to enhance its performance. By comparison the DIN 22101 dynamic splice efficiency standard, for a 6.7:1 rated steel cord belt, is approximately 36%. The 58% rating is very high for an ST-3000 N/mm belt.
The belt was shipped in double reels or casette units. This reduced field splices by half to 70. It reduces a major concern about splice reliability and tracking errors, The dual cassettes were wound onto one drum before installation.
6.2 Idlers
The large idler roll diameters were specified with a close runout finish of 0.65 mm TIR. The idler alignment was controlled by instrument checking every idler frame during fabrication and classifying its accuracy. The frames were classified by their tested idler position control. Three tolerance categories were made (1 mm, 2 mm and 3 mm), such that within a category the tolerances were within 1 mm, The idler stringer frames were installed to within 1 mm for vertical and transverse alignment to the belt axis. The idler roll bearing life was designed to exceed of 60,000 L-10 hours. After one year of service, the manufacturer, Prok of Australia, claimed that no idlers have been replaced due to failure. Prok built the rollers, their supporting pipe members, and built the testing facility for verifying the manufacturing accuracy.
No forward tilt of the idlers was permitted. The conveyor accurate manufacturing and installation procedures required no idler adjustments during commissioning.
6.3 Motors and Controls
Each conveyor is equipped with three 700 kW DC motors. The three drives are located at the head station. A head-tail station drive method was reviewed. The client (CMS) determined that the cost savings versus downtime required by their electrical lockout procedures would not be cost effective in the long run.
The DC drive was initially selected to provide reduced speed, at reduced tonnage, until the Channar pit goes into full production some year(s) in the future. The use of DC controls proved very helpful during commissioning. Alternative speeds and loading conditions were studied. Belt resonant frequency effects were studied. An optimal speed was found that virtually eliminated any resonance.
6.4 Horizontal Curve
The 9 km horizontal curve was installed to the design specifications. Minenco selected the curve radius based on the projects civil requirements. The radius followed the toe of a natural terrain drainage held. Both top and bottom strand track close to the prediction. Because of the lower idler indention loss, lower belt tensions are realized. The belt tends to track about 50 mm off center towards the outer edge under full load. This has not been a problem, since the banking angles are slight and 150 mm clearance is provided between belt edge and steel-work.
7. Conclusion
The Channar conveyor system is indeed the flagship of modern belt conveyor technology. The project was a successful and rewarding experience. The concern for good engineering was evident throughout the project. Many detailed studies were made on design options.
In the final assessment, if such a conveyor were built today, the author would recommend most of the features and criteria used to provide a highly reliable and cost effective installation. Much of the mystery about the low power consumption has been resolved.
The viscoelastic analytic procedure for power analysis provides a significant increase in accuracy and should be adopted. The NPV idler optimization selection, manufacturing and installation accuracy show that these tools are very cost effective.
Acknowledgements
The author would like to extend his thanks to Minenco and CMS for offering him the opportunity to participate on this most exciting project, and especially to David Beckley for fine engineering and productive dialogue.
References
[1] Channar is the first new iron era mine in Australia In 15 years: E&MJ, August 1991, pp. 16-45.
[2] Behrends. U.: Untersucbungen zum walk Widerstand schwerer Frderbandanlagen; Dissertation, Tech. Univ. Hannover, Germany, 1967.
[3] Schwarz, F. Untersuchungen zum Eindruckrollwiderstand zwischen Frdergurt und Tragrolle; Dissertation, Tech. univ. Hannover. Germany, 1966.
[4] CEMA (USA): Belt Conveyers for Bulk Materials; Third Edition, 1968.
[5] International Standard ISO 5048: Continuous Mechanical Handling Equipment; First Edition (1979),
[6] DIN 22101: Belt conveyers for Bulk Materials, 1982.
[7] Spaans, C.: The Indention Resistance of Belt Conveyors; Delft Tech. Univ., Dept. Mach, Eng. WTHD Nr. 103, Jan, 1978.
[8] Jonkers, C.: The Indention Rolling Resistance of Belt Conveyors; Frdern und Heben, vol. 30, (1980) pp. 312-318.
[9] May Morris & Atack: Rolling Friction of a Hard cylinder over a Viscoelastic Material; Applied Physics. vol. 30, Nr. 1, Nov. 1959.
[10] Spaans, C.: The Flexure Resistance of Belt Conveyors; Delft Tech. Univ., Dept. Mech. Eng. WTHD Nr. 117, Sept. 1979.
[11] Limberg, H.: Untersuchung der trumbezogenen Bewegungswiderstnde von Gurtfrderanlagen; Dissertation, Tech, Univ. Hannover, Germany, 1988.
[12] Greune, A.: Energiesparende Auslegung von Gurtfrderanlagen; Dissertation, Tech. Univ. Hannover, Germany, 1989.
[13] Hager. Al.: chances for Development in Belt Conveyor Technology in Open Pit Mines; bulk solids handling, Vol. 11 (1991) Nr. 1, pp:157-167.
[14] Nordell, L. and Ciozda, Z.: Transient Belt Stresses During Starting and Stopping: Elastic Response Simulated by Finite Element Methods: bulk solids handling, Vol. 4, (1984) Nr. 1, pp. 93-98.
[15] Nordell, L.: Improved High Capacity Conveyor Designs; Paper presented at AMC Annual Meeting, 1989.