 |
 |
Improving Belt Conveyor Efficiencies: Power, Strength and Life
Overland System Case Studies
Lawrence K. Nordell
Conveyor Dynamics. Inc. (USA)
April 1998
| |
|
|
UBIQUITOUS -
He who knows not and knows not that he knows not is a fool.
He who knows not and knows he that knows not is a child.
He who knows and knows not that he knows is asleep.
He who knows and knows that he knows is a wise man. An Arab proverb |
1.0 ABSTRACT
A general overview is presented on modem overland engineering methods Conveyor Dynamics, Inc. uses in determining: a) conveyor bell frictional rolling resistance, b) belt strength criteria and its relation to belt splice dynamic efficiency, c) belt cover life determination associated with transfer station design (rockbox and curved chute), and d) issues of noise generation. Significant improvements in performance and cost can be realized by properly quantifying The cover and core rubber properties, and in mitigating belt damage at the transfer station.2.0 INTRODUCTION
Belt conveyor engineering has taken new form to meet the users demands for more utility to meet their capital and operating budget. The supplier is now asked to guarantee:
1. minimum capital cost,
2. maximum kW-hrs/ton/km to transport at the design criteria:
3. replacement rate of consumable goods, such as idlers and belting.To meet These increased demands, new engineering tools have been developed to improve accuracy of analysis and to support gains in the manufacturers material science technologies resulting in improved efficiencies in four major cost and performance categories:
a) Power reduction through lower rolling resistance,
b) Strength reduction through improved splice efficiency,
c) Dynamics and controls;
d) Cover life increase through reduction in wear at transfers.These new tools are presented together with actual field measurements on numerous projects that demonstrate their validity.
Often the client restricts the application of these tools by imposing a less informed consultant's criteria into the design specifications. The hope is that the consultant can standardize all submitted designs whereby the best price will be obvious. This does not necessarily produce either the best design, the best price, or an efficient design, It does produce a design with which the consultant can be comfortable.
Five case studies are discussed in which accuracy of the theory versus practice can be compared:
1.
20.5 km
Channar curved overland
1989
Australia
2.
5.2 km
German Creek curved overland
1995
Australia
3.
15.6 km
ZISCO curved overland
1996
Zimbabwe
4.
13.5 km
Muja /Collie curved overland
1998
Australia
5.
24.0 km
Indo Kodeco overland
1998
Indonesia
A reference is made to the above cases if the normal design standards, such as CEMA (Conveyor Equipment Manufacturers Association - U.S.A.), were applied.
A brief note on conveyor noise is presented, taken from field measurements.
IN BUSINESS, TECHNOLOGY IS LIKE MONEY.
USE IT OR LOSE IT!3.0 NEW METHODS OF ANALYSIS
The new methods of analysis assist the belt suppliers with economic incentives to recommend products whose components cost more; require expenditures in R & D, but, which return both lower capital and operating cost to the client.
Speaking from first hand experience, I have witnessed a client squander millions of dollars on replacement belting because the original belt had a specific strength rating circa 1972. Today's redesigned replacement belt would be at half the 1972 rating, with a further reduction of 10 of the 50 motors in operation. The client said he could not believe such savings were possible, and proceeded to buy a 25 year old technology in lieu of its present day alternative.
This anecdotal story is repeated ad nauseam, throughout the world, by purchasing agents seeking replacement belt. Replacements are estimated at over $1 billion USD annually. Total belt orders exceed $1.5 billion USD per year worldwide.
Belt manufacturers are now investing in superior rubber compounds for lower cover rolling resistance and higher splice core rubber fatigue strength, because engineering technology can now confirm the benefits. The total cost benefit can be evaluated which forces the suppliers to meet the Utility Value (Best Price vs. Measurable Performance) or lose sales.
Using some rough estimates on birth and death rates of mines/belts, and on an average belt transport configuration. I estimate conveyor belts world wide to consume approximately 20 billion kW-hrs per year. just to rotate their mass and payload (i.e. lift power is not included). This seems like a compelling number to justify improvements in rolling efficiency. Power can be reduced on all belt conveyors.
The belt can represent more than 60% of the overland conveyor capital investment. Applying modern engineering analysis together with improved rubber material properties can reduce the capital investment budget by 10-30% in comparison with published design standards.
3.1 Power Analysis - Rubber Viscoelestic Theory
Many publications have described the methods of analyzing the rubber's hysteresis losses when the cover deforms in contact with the idler rolls [I. 2, 3, 4 and 5.11]. Reference [5] "The Power of Rubber - Part I", provides a set of illustrations of the various loss factors borrowed here from reference [5] in Figures 1 through 5. The method is based on classical mechanics.
Figure 1 is a schematic used to demonstrate the main rolling parameters Ky or the DIN "f" factor used by the majority of world standards : CEMA, DIN 22101; ISO 5048.
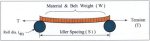
Figure 1 - Rolling Resistance Parameters
|
Rolling Resistance Coefficient (Ky): |
|||
| CEMA | : | K y = f(W, Temp ,Si, T) + C(Temp, Si, T) | Empirical Method |
| DIN | : | K y = f(W, Temp) + C | Empirical Method |
| ISO | : | K y = f(W, Temp) + C(L) | Empirical Method |
| CDI | : | K y = Ky1 + Ky2 + Ky3 (Steel Cord) | Viscoelestic Rheological Method |
| K y1 | = | Idler Roll Indention Loss | |
| = | f(W, Temp, Si, T, V, %LDG, a, Φ, LC, Bm(x, y), BW, TC, TB, E', E") | ||
| K y2 | = | Belt Flexural Loss (bending belt at idlers and between idlers) | |
| = | f(Ky1 properties plus material internal friction properties) | ||
| K y3 | = | Material Trampling Loss (agitation of ore due to belt flexure) | |
| = | f(Ky1; Ky2 properties) | ||
|
|
||
|
where: |
||
|
W |
: |
Material + Belt weight per unit length |
| Temp | : |
Temperature Factor (CEMA Kt or equivalent) |
| Si | : |
Idler Spacing |
| T | : |
Belt Tension |
| C | : |
Constant Factor - losses from pulley bearings, scrapers, skirts; material acceleration (DIN; ISO only) |
| C(L) | : |
Contact factor dependent on a conveyor's length |
| V | : |
Belt Velocity |
| %LDG | : |
Belt Cross - sectional Load |
| a | : |
Idler Troughing Angle |
| Φ | : |
Idler Roll Diameter |
| LC | : | Idler Center Roll Length |
| Bm(x, y) | : | Belt Bending Modulus in ( x) axial; (y) transverse planes |
| BW | : | Belt Width |
| TC | : | Top Cover Thickness |
| TB | : | Bottom Cover Thickness |
| E' | : | Rubber Viscoelestic Dynamic Modulus - f(polymer, temp, freq; strain) |
| E" | : | Rubber Viscoelestic Loss Modulus - f(polymer, temp, freq; strain) |
Figure 2 illustrates the unequal pressure distribution of the belt pressing on the idler roll, in cross-section, due to material and bolt mass per one idler span. All pressure gradients must be represented in modeling the indention deformation shown in Figure 3. Low pressure near the edge causes low deformation (1-2% strain) resulting in a high rubber excitation or strain rate. High pressure near the idler junction and on the center roll cause higher rubber deformation (2-5%) and lower rubber strain rate. The strain rate is inversely proportional to temperature. High strain rates are analogous to operating at colder temperature and vice versa. These properties must be accounted for in the viscosity rolling resistance analysis.
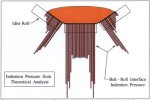
Figure 2 - Unequal Pressure distribution on the idlers
Figure 3 illustrates the viscoelastic designated idler indention loss parameter Ky1. The colored region denotes the bottom belt cover rubber deformed region. The diagram illustrates the imbalance of forces caused by a belt moving over an idler roll at an arbitrary location along the roll's length. Terms: "F1" is The sum of the forces the belt pushes on the idler roll at the centroid of the force "F1" to the left of the idler roll vertical centerline at distance "a1". "F2"is the net force to the right of the idler roll centerline at its center of effort at distance "a1". The net rolling resistance is the algebraic difference of the moment F1*a1-F2*a2 divided by The idler radius (R). At rest, the sum of the moments are in balance (zero). As the belt moves left to right, the rubber cannot recover at increased speeds or reduced temperatures due to its relaxation (stress-strain) memory properties. The recovery contact zone to the right of the centerline creates a lower restoring moment thereby causing a resistance to rolling.
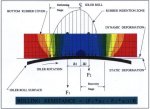
Figure 3 - Rolling Indention Losses
Figure 4 shows a half belt cut along the longitudinal axis over one idler span illustrating the Ky2 and Ky3 losses. The belt and material sag between idlers and tend to sag more with higher material loads, like a hammock. The change in shape causes losses due to the belt bending (Ky2) and material agitation (Ky3). Ky2 and Ky3 must be solved simultaneously. This is the most difficult of The Ky analytic procedures. These losses can become predominant in fabric belt, with large, wide belts, and belts with large idler spacing.
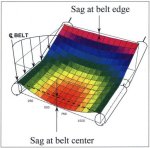
Figure 4 - Belt Flexure and Material Tramping losses
Figure 5 illustrates The belt-idler rolling indention laboratory test machine. Test results and accurate theoretical comparisons, are described in [5].
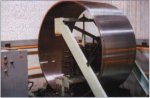
Figure 5 - Belt Idler Roller Indention Testing Machine
Figure 6 is the belt and material flexural test machine.

Figure 6 - Belt and material flexural test machine
Figure 7 is a manufacturer's promotional photo of the Rheometrics Dynamic Mechanical Analyzer (DMA) for testing cover rubber viscoelastic properties noted in [4].
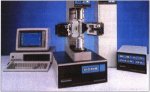
Figure 7 - Dynamic Mechanical Analyzer (DMA)
Figure 8 illustrates the spectrum of 24 cover rubbers tested at CDI measured by their performance on a standardized conveyor belt over a given temperature range. This spectrum of rubber types provides a reasonable envelope of different compounds in use today for normal, hot belts, and belt compound for special chemical properties. It is not exhaustive of the tests performed. Points of interest include some belts which have monotonically increasing power with increasing temperature. Most belts increase in power as they get colder due to the rise in internal hysteresis (E") exceeding the reduction in deformation ( E' ) due to rubber hardening. At between -20 C and -35 C, most belt polymers begin to crystallize. The hysteresis falls off as crystallization hardening takes place, yielding a fall in power as noted in [5].
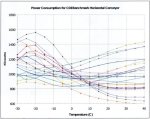
Figure 8 - Spectrum of 24 cover rubbers
Idler diameter, trough shape and spacing are important factors in assessing power and performance. Larger idler rolls will always reduce power [5]. See Table 1. First, the torque arm to rotate bearing and seals is larger. Second, referencing Figure 3, the belt contact zone with the idler is longer. minimizing the proportional difference between the rubber recovery zone and the initial deformed stage, and the radius increase reduces the rolling resistance referenced at the belt line. Trough shape and idler spacing are more complex due to belt construction features. They will not be reviewed in this paper.
Rubber Indention Power Reduction: 1 - (d1/d2)2/3
Roll Diameter (d2)mm
Roll dia
(d1)mm127
133
152
159
178
219
127
---
.030
.113
.139
.201
.305
133
---
.085
.112
.177
.283
152
---
.030
.100
.216
159
---
.073
.192
178
---
.129
219
---
Table 1: Idler roll indention power sensitivity
Theory and measurement of power are given for the five case studies at their design tonnage in Table 2:
Mine
Capacity
Speed
Power Demand
CEMA
% Dev
CDI
%Dev
Actual
Channar 10.3 km
2200 t/h
4.1 m/s
1800
67
1108
<5
1076
German Creek 5.2 km
1600 t/h
4.0 m/s
831
21
641
<5
650
Zisco(1) 15.6 km
(removing curve pressure)500 t/h
4.3 m/s
910
738102
64622
52838
17450
450Muja 6.1 km
770 t/h
4.6 m/s
681
106
337
<5
331
Indo Kodeco (1) 9.0 km
2500 t/h
3.6 m/s
1542
43
1187
10
1079
Table 2 : Five CDI Case Studies Tabulating Calculated vs. Measured Power
|
Note 1: |
No motor shaft torque measurements were conducted. No weight scale readings were integrated over profile. The final earth grade was modified (more gentle terrain) from the design analysis date noted here. ZISCO calculations are given with and without belt pressure due to vertical and horizontal radii to show curve terrain differences. |
Table 3 illustrates the individual component parts that sum to the demand power for both CEMA and CDI for the Barclay Mowlem German Creek design. Some points of interest with the CEMA makeup are:
a) Item 3, Material Flexure or motion, equals the sum of all (Ky) (Wm), where Wm equals the unit material weight,
b) Item 4,Belt Flexure equals The sum of all (Ky) (Kt) (Wb) along the respective carry and return lengths.
Their difference is a result of both different tensions and different Ky. "Kt" is the temperature correction multiple and "Wb" is the unit belt weight. The cumulative percentages of these items makeup 75% of the total CEMA calculated power. By contrast, The CDI analysis shows rubber rheological indention plus belt bending losses contribute 62% (items 1 and 4). Material motion loss is 7% in item 3. The true power demand is projected to be 650 kW for the conditions analyzed. See Figure 9. CEMA deviates by 22% and CDI's measurable deviation is less than 5%.
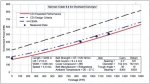
Figure 9 - German Creek Power Consumption
Item
Description of Loss
CEMA
CDI
kW
% of Total
kW
% of Total
1.
Idler/belt indention losses
Belt Rheology
0
0
310.7
48
Idler roll rheology
0
0
0
0
2.
Idler/belt shear losses
Belt G`
0
0
0
0
Idler roll G`
0
0
0
0
Idler diameter variation
0
0
0
0
3.
Material flexure (/Tym)
411.7
53
47
7
4.
Belt flexure
Carry side (Tyc)
96.4
12
70.5
11
Return side (Tyr)
82.1
10
20
3
5.
Conveyor misalignment
0
0
0
0
6.
Drive transmission loss
25
3
23.4
4
7.
Idler losses - carry side
Coulomb friction
21.3
3
21.3
3
Seal drag
29.8
4
29.8
5
Viscous drag
0
0
0
0
8.
Idler losses - return side
Coulomb friction
4.3
1
4.3
1
Seal drag
6.7
1
6.7
1
Viscous drag
0
0
0
0
9.
Material lift (Tm)
94.2
12
94.2
15
10.
Material acceleration (Tam)
3.6
0
3.6
0
11.
Pulley friction (non-drive)
0.9
0
0.9
0
12.
Accessory friction - skirtboards
3.3
0
3.3
1
13.
Accessory friction - belt cleaners
5
1
5
1
14.
TOTAL
784.3
100
640.7
100
Table 3: Itemised division of power losses for CEMA and viscoeleastic (CDI) methods
for German CreekSo what difference does the rubber rolling resistance make? As noted earlier about 20 billion kW-hrs are consumed by belt conveyors world wide per year, equivalent to move belt and material around the circumference of our planet about six times.
Belt cover stock is normally sold on price and abrasion resistance, not rolling resistance. The polymer is bulked out with inert fillers (clay, ash, low grade carbon; oils) to increase the total rubber volume. This makes for a low budget belt. Rubber, can cost many times the filler cost. Unfortunately, many of the fillers used increase the internal hysteresis (E" )
Demand power of four compounds are compared against CEMA for the German Creek project presented in the case studies:
Compound A
476 kW
-26%
Compound B
588 kW
-8%
Compound C
641 kW
Basis
Compound D
713 kW
+11% (low budget)
CEMA
784 kW
+22%
The consultant's design criteria often specify using CEMA, DIN or ISO for roiling resistance computation. Bigger belts and drives result from applying these standards. The operator gets hidden reserves if the project can make the budget cut. Since no effort is made to specify a superior rolling resistance compound, the electric bill continues to grow. Today on new projects, sonic consultants such as Sedgeman's are allowing the supplier, such as Barclay Mowlem, to justify the methods of computation and belt selection that trend toward compound A.
The day of the belt power hog is in its twilight. I urge you to think about the future. The sums will prove you can afford to buy a more environmentally friendly belt. Everybody wins.
3.2 Belt Strength Reduction - Splice Efficiency
The chain is only as strong as its weakest link. In conveyor belts, everyone is aware that the weak link Is the splice. Most engineers, contractors, consultants, and operators turn to the manufacturers for guidance on the "weak link" recommendation. This usually starts with the engineer nominating an ST-rating based on a "dubious" power calculation and on selecting a belt safety factor (SF) Few consider the importance of the splice dynamic efficiency, only the static efficiency. Does the manufacturer know the best pattern? This is also in doubt with some suppliers. Most do not have any method of analyzing the theoretical splice endurance limits. Look at DIN 22129 and DIN 22131. These standards recommend different patterns for the same belt strength. Three manufacturers may recommend three different patterns. Can they all be right?
Through analysis and experimental testing an optimization procedure is now in place to recommend the splice construction for the available cable sizes and manufacturer's rubber material performance. Core rubber endurance can vary dramatically among manufacturers. Testing must be performed to rate each manufacturer's core rubber.
Figure 10 is taken from [6]. It is an interpretation of the steel cord splice dynamic efficiency and safety factor designed in DIN 22101. Figure 10 illustrates the composition of the safety factor made from four distinct design criteria: running tension, starting tension, elongation and age degradation, and splice efficiency loss in 10,000 load cycles. The latter criterion is taken from hundreds of tests at Hannover University in Germany that last for no more than one week, while accumulating 10,000 load cycles on the splice destructive test machine. This standard reflects the DIN criteria that defines sufficient time to establish the form of the fatigue curve.
Figure 11 illustrates a further continuance of the rubber H-block fatigue cycle. The graph represents fatigue data points for different rubber stress levels and different gaps between cords. The two major lines represent the stress vs. life cycle for different compounds. Each major compound is an estimated error of +/- 10% shown by the banded lines above and below each major curve. Note, taking the natural log of the cycles, the line is nearly linear up to about 100,000 cycles. Between 80,000 and 100,000 cycles a different fatigue mechanism becomes dominant which is not shown here. The value of SF = 6.7 :1 is constructed from the following 5 steps:
Assume a running tension of unity = 1.0.
Assume a staling tension limited to 40% of running, i.e. 1.4:1.
Assume elongation and degradation (age, alignment, pulley bending, construction errors, et al.) equal the running value (1.0) defined in DIN 22101 (r2). when added to the starting value we get 2.4, a multiple of the running criteria.
Hannover tested many steel cord belts and found that after one week or 10,000 revolutions a reasonably well constructed splice retained about 36% of the belt's breaking strength.
Thus, the safety factor 6.7 equals the residual 36% splice fatigue strength divided into The required capacity of 2.4 times the running load (2.4 / .36 = 6.7 :1) per step 3.
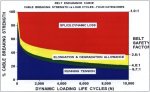
Figure 10 - Belt and Splice Endurance Curve & Safety Factor
A further breakdown of The "elongation and degradation" allowance is cited in [6] and [7].
This fifth step is the key to predicting other safety factors. For example, if we tested a belt and achieved a 50% splice efficiency, the DIN rule would yield a SF = 4.8 : 1 (i.e. 2.4 / .50 = 4.8 :1). If we could lower The starting multiple to 1.25, along with the 50% splice endurance, then the safety factor would be SF = 4.5:1 (i.e. 1.0 + l.25 + 1.0 = 2.25 /.5). And finally, if The DIN 22101 (r2) value of elongation and degradation could be reduced by better belt and splice construction, fewer bend pulleys, better belt alignment, the elongation parameter could be reduced to 0.75. The resulting safety factor could reliably be reduced to SF = 4.0 :1(1.0 + 0.25 + 0.75 = 2.00 / 0.50 = 4.0 :1). These are only examples.
There are a number of problems with the DIN 22101 reasoning. First, elongation and degradation should be added to the running value as a continuous load. Second, the starting multiple of 1.4 times the running load is a very infrequent cyclic addition and should not be computed as a continuous fatigue factor [6]. Third, the running tension is usually set as the peak running force which is rarely achieved. The nominal running force, in operation the majority of the time, which fatigues the splice, is usually about 80% of the peak design force. Fourth, the number of cycles that a splice is subjected to over 10 years vastly exceeds 10,000 cycles. For example, a 1000 meter belt running at 5 m/s, running at "peak" load for 5000 hours per year, accumulated roughly 8 cycles per hour and 400,000 cycles in 10 years (8 cycles/hour x 5000 hours/year x 10 years = 400,000 cycles). Therefore. 400,000 cycles is the fatigue stress criterion. A rationale of the true stress histogram instead of the peak force is given in [7].
We have performed many fatigue tests on small rubber samples from various manufacturers to evaluate the rubber endurance as shown in Figure 11. A hydraulically controlled 55 Kip Instron machine performs axial fatigue testing on core rubber and cables. The machine can test hot and cold belts. A hot belt test was performed on the BHP-DRI 7.2 km overland belt to determine the influence on power and strength of the +100C briquettes transported on the return strand. The selected manufacturer was able to meet all performance criteria. A number of manufacturers could not meet the splice strength and whose predicted rolling resistance exceeded the conveyors installed power.
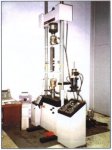
Figure 11 - Instron H-Block Testing Apparatus and typical fatigue test results
Given that we have an expectation of splice endurance based on the previous comments, The final step is to design a splice pattern that meets the stress loading criteria or limitation as determined by the FEM analysis illustrated in Figure 12. The optimal splice efficiency then sets the belt "ST" rating as outlined above, which may be influenced by steel cord diameter availability, standardization with other belts, etc.
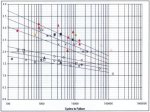
Figure 12 - Finite Element Analysis of Belt Splice
Verification of this procedure is then carried out by destructive testing using a number of repeat splice patterns (4-5) made into a continuous loop of belt. CDI built a machine in 1996 to carry out testing up to ST-10,000 N/mm belt ratings, as shown in Figure 13.
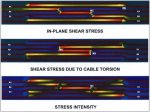
Figure 13 - CDI Splice Fatigue Testing Machine
CDI has designed a 2step ST-5100 N/mm belt splice pattern that tested over 60% splice efficiency. Four step and five step splices have been tested to more than 50% efficiency. The strongest belt tested to date is 31-8800 N/mm, it ran for 12,626
cycles before breaking the cables in the bend zone. The splice has a dynamic strength rating of ST-4400 N/mm. This Is the worlds' strongest steel cord splice as defined by DIN 22110.All high strength belt splices tested, designed by CDI, have not failed the rubber. The cables have failed outside the splice zone. All of these successes have been achieved with Bridgestone belts. Much credit is due to their superior core rubber endurance and metal bonding efficiency. Some manufacturers have recently tested ST-8000 N/mm class belts at 50% splice efficiency on the Hannover test facility.
The point is that the benchmark has been raised significantly from published works.
High strength German belt has also been tested on the CDI machine and passed 10,000 load cycles, with an ST-6300 N/mm belt rating at close to 50% splice efficiency.
If we rate the belt by its splice strength and not the ST value, some interesting comparisons can be observed:
Project
Year
ST-Rating
(N/mm)Tested
EfficiencySplice Pitch
Strength (N/mm)1.
Prosper Haniel
1985
ST-7500(1)
0.367
2750
2.
Palabora
1988
ST-6600(1)
0.500
3300
3.
El Abra
1995
ST-6800(1)
0.500
3400
4.
Escondida
1995
ST-5100(2)
0.600
3060
Belts in service
-----------------------------------------------------------------------------
Belts in test
5.
Los Pelambres
1998
ST-7800(1)
0.500
3900
6.
Evaluations
1998
ST-8500(3)
0.500
4250
1998
ST-8814(4)
0.500
4407
Notes:
Hannover tested to 10,000 load cycles (German manufacturers)
Escondida is a 2-step splice. The belt and splice were built by Bridgestone and designed by CDI. The load cycles exceed 10.000.
Achieved 12,626 load cycles (Bridgestone)
Items 3-4 have an ST-rating based on pitch strength not belt strength.
No motor shaft torque measurements were conducted. No weight scale readings were integrated over profile. The final earth grade was modified (more gentle terrain) from the design analysis date noted here. ZISCO calculations are given with and without belt pressure due to vertical and horizontal radii to show curve terrain differences.
None of the above belts can be considered typical. All have special features that raise their performance.
In conclusion, belt splice dynamic strength has achieved new levels of performance. Cable endurance is now the limiting factor to higher efficiency. Advanced rubber properties can yield reliable splice efficiencies above 50% for all belt strengths. The designer must take cam and validate the rubber, steel cord, splice pattern, splicing machine, and construction efficacy before proceeding to utilize these advancements.
3.3 Dynamic Control
3.3.1 General
Starting and stopping overland and high powered conveyors usually benefit from "dynamic analysis." Dynamic analysis "dynamics" is a mathematical procedure that determines the belts elastic behavior to time transient force perturbations, such as starting from motors, brakes, take up pulley ramming into its stop, belt jam. etc. Dynamics can be defined as the evaluation and control of shock waves (tensile and compression waves) traveling in the belt, produced by a forcing function, such as the application of motor torque or brake action by a defined control. The control can be a fluid coupling, wound rotor, DC, variable frequency inverter, or regulated hydraulic brake. Dynamics can result in destructive consequences if not properly understood as shown in Figure 14.

Figure 14 - Structural Failure resulting from dynamic shock waves
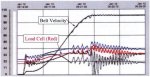
CDI commissioned a 15.6 km overland in Zimbabwe in collaboration with Bateman Materials Handling (BMH) of South Africa. The overland has one tail and three head drives, all controlled with variable frequency inverters (VFD). Figure 15 illustrates dynamic instability that did occur due to the elastic stretch in the belt caused by an error in regulating speed and load sharing among drives. The instability was caused by The VFD manufacturers control algorithm. After a number of attempts, the VFD manufacturer asked for assistance. The load sharing control algorithm was then programmed into the system PLC by CDI. Figure 16 illustrates the successful startup and load sharing regulation with the PLC algorithm. Belt elastic response must be considered in long conveyors with multiple drives / brakes during their starting and stopping. Over control can lead to uncontrolled belt vibrations similar to no control.
|
Figure 15 - Starting control instability |
Figure 16 - Starting control stabilised |
3.3.2 Programmable Controllers
Programmable logic controllers (PLC's) are often used to regulate fluid couplings and clutches to start and stop large conveyors. Unfortunately, the many suppliers of PLC's throughout the world each have their own way of doing things. Their evolution follows the computer industry, each system with its own unique language and documentation on usage. A larger and larger support base must follow their evolution.
The mechanical coupling (Voith, Falk; Sime) and clutch (Dodge CST, Boso; Nepean) must use a PLC or similar logic controller to regulate the starting / stopping cycle. Often the PLC supply is dictated by the mine. The coupling / clutch supplier must keep trained in the latest PLC hardware and software in addition to the mechanical hardware. With time, The coupling / clutch supplier must maintain a large support base for old and new PLC systems which will become untenable.
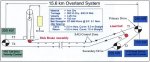
To overcome the large PLC support requirement CDI designed and built a general purpose controller that has all control parameters preprogrammed in firmware as well as all hardware input /output devices to control coupling /clutch functions. A generic algorithm can start and stop a conveyor will multiple drives up to 24 on one belt. All plant PLC communication, load sharing, and fault functions are built in, together with operator interface hardware and software. The controller can stand alone or be integrated into a PLC system like lndo Kodeco's 24 km overland system shown in Figure 17. Five conveyers are driven by their bead and/or tail pulleys, up to 9 km apart, with multiple scoop controlled Voith fluid couplings. Load sharing regulation is nearly as smooth as the VFD drive among the three couplings on three pulleys as shown in Figure 18a.
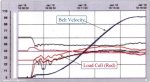
Figure 17 - Indo Kodeco Overland Conveyor System
The controller is shown in Figure 18.
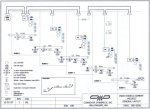
Figure 18 - Voith Coupling Starting Measurements and CST Controller
Dodge (Rockwell Automation) partnered with CDI in the development of the general purpose controller. Their aim was to minimize dependence on the changing PLC world. They took the initiative to install the controller in the U.S.A. and China on a number of mines. Figure 19 is an application of the controller on the largest incline conveyor in China, commissioned one year ago.
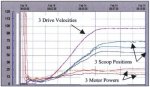
Figure 19 - CST Controller installed in China
3.4 Belt Life - Wear Prediction
Prediction of belt wear due to ore turbulence at the transfer station has until now been an elusive task. Where prediction must include knowledge of: 5) The damage mechanisms, b) The forces at work, and c) the material properties.
CDI has developed a mathematical tool which provides information on the damage mechanism and on the forces which cause the damage. The tool is based on the Discrete Element Method (DEM). Details of the DEM principles are provided in my second paper in this conference [8]. DEM can simulate ore flow by modeling the physical motion of a representative number of particles with similar size, shape, mass, size distributor, particle to particle interaction, and particle to liner interaction. Figure 20 illustrates a typical belt feeder chute, ore flow stream (DEM particles), and receiving belt.

Figure 20 - Typical DEM flow through a transfer chute system
DEM can record all particle-particle, particle-wall, and particle-belt impact and sliding action. The damage mechanisms are abrasion and gouging.
Abrasion is defined as the sum of the particle forces (pressure) times their respective sliding distance (differential or slip velocity) recorded on a given region of belt over a given time.
Gouging is defined to occur when a particle impacts the belt with sufficient force to cause the belt surface to deform where the rubber's yield strength is exceeded, thereby causing a crack which may then tear due to the shear force applied. DEM can separate these variables.
The DEM model was first used at Palabora in South Africa. A 16 degree slope belt receives 6500 t/h of -300mm copper ore with a belt speed of 4 m/s. The original belt transfer was designed with, a conventional rockbox. The belt is 1800mm wide with a rating of ST-0600 N/mm, with 18 x 9 mm covers. The belt wore down to the steel cords in three years.
CDI was commissioned to re-engineer the rockbox [8][9]. A curved chute design was proposed. Palabora built and installed the curved chute in early April 1994. After four years of operation, there is little discernable wear on this belt. Frequent belt inspection data project this wear life to exceed 20 years. The NPV return on this chute investment is estimated at $3 million USD.
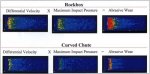
Based or DEM modeling, the abrasion and gouging indices were estimated for the rockbox and new curved chute. Figures 21 and 22 illustrate the damage region and its magnitude for rockbox and curved chute. Figure 21 illustrates the intensity of slip velocity and impact between ore and belt across the width and along the axial path. Combining impact with slip yields abrasion as illustrated. Figure 22 sums the damage of Figure 21. Wear damage on the upper graph is plotted across the belt width. The lower graph of Figure 21 shows the impact pressure field across the belt, We theorized the impact pressure was causing major gouging damage.
|
Figure 21 - DEM results showing impact |
Figure 22 - Abrasive wear
integrated |
The curved chute design reduced the impact pressure below the critical rubber yield point. This stopped the gouging damage. Curved chute abrasion is reduced to about a third of the rockbox.
Secondary benefits are:
Significantly better belt cleaning due to smooth belt surface
Little material carryback due to better belt cleaning
Spillage after load station reduced due to ore interlocking at transfer, elimination spin and bounce
Safer environment through reduced ore turbulence
Less damage to impact idlers
No puncture and gouging damage from tramp metal
4.0 CASE STUDIES
Four installations are reviewed for their measured power versus the CDI viscoelastic analytic method.
The large pitched spacing of ZISCO's (Zimbabwe Iron & Steel Company) 15.6 km overland may also be of interest. At the time of commissioning in 1996 this was the world's longest single flite troughed belt.
4.1 20.5 km Channar (Western Australia)
This is still a world class benchmark installation shown in Figure 23. It was commissioned in 1989. CDI was the consultant to Minenco on the design. A bit of controversy arose when two auditors argued that the two belts were under rated, under powered, the brakes were too small, and one argued the horizontal curve banking angles were not steep enough. The belt strength was increased to ST-3000 N/mm from ST-2500 N/mm. The drives were increased from 3 x 625 kW to 3 x 700 kW on each conveyor. The brakes and curve banking angle were not changed.
Today each flite runs on 2 * 700 kW. It is the worlds most efficient running belt, in terms of demand power, as defined by the overall DIN factor f=0.009.
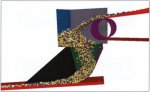
Figure 23 - Channar Overland Conveyor System
4.2 5.2 km German Creek (Emerald City, NSW)
The system was commissioned by Barclay Mowlem in 1995 and is illustrated in Figures 24 and 25. CDI strain gauged the two low speed drive shafts to monitor power going directly to the belt. Figure 9 shows measured versus estimated power for a number of tonnages. The actual data points fall just below the CDI design criteria for the bid. The points are just above the theoretical expectation. For interest, the CEMA power calculation is plotting using the installed equipment specifications (CDI belt strength criteria).
|
Figure 24 - German Creek
Overland |
Figure 25 - German Creek
Overland |
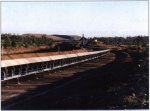
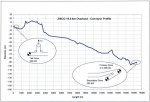
4.3 15.6 km Zisco Curved Overland (Zimbabwe)
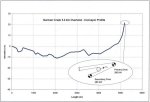
ZISCO was the world's longest single flite conventional troughed belt when commissioned in December 1996. See Figures 27 and 28. Details of its design are written in [10]. Points of interest are: a) drive system location and starting control, b) take-up location, c) use of booster drive concept, and d) idler spacing and support system.
|
Figure 27 - ZISCO Overland System |
Figure 28 - ZISCO Overland System Profile |
Drive System: Four 250 kW variable frequency drives (VFD) are used. See Figure 29 for a legend. The master velocity ramp 250 kW drive is located at the tail. The head pulley has 2 x 250 kW VFD's followed by 1 x 260 kW on the adjacent secondary drive pulley. The conveyor is started by the tail drive, which follows a 500 second acceleration ramp. The tail pulls tension on the return strand raising the tension at the load cell. The secondary drive accelerates on a ramp with the head drive. The load cell limits secondary power if the value falls to low. The primary matches or is slaved to the secondary drive.
|
Figure 29 - ZISCO Overland System |
Figure 30 - ZISCO Support System |
Take-up: A gravity take-up is located just after the tall drive on the carry strand. The gravity take-up was located here to control the horizontal curve tensions and belt displacement near the tail. The take-up weighs 80 tons.
Booster Drive: The system is essentially a 16 km conveyor with a tail master drive and a head booster station 16 km remote to the master. It works as advertised.
Idler Spacing & Support System: Figure 30 illustrates the novel idler support system. The conveyor has no stringers. Each U-frame supports one carry idler and one return idler every other frame. The idlers are pitched at 5.0 m spacing on the carry side in the straight sections and 2.5 m in the horizontal curve. The return idlers are spaced twice the carry strand. Vibration modes were studied to eliminate any sympathetic belt flap to the idler spin frequency. The concrete sleepers were aligned to the belt axis to improve idler alignment with the long pitch distance.
4.4 6.1 km Muja Curved Overland (Western Australia)
Western Colliery awarded the Muja / Collie 13.5 km overland to Barclay Mowlem in 1997. Barclay Mowlem have commissioned the 6 km Muja overland. CDI assisted Barclay Mowlem with the mechanical design. The points of interest are: a) measured versus calculated power, and b) the sleek modern style of hood and idler support system.
Figure 31 illustrates the general form similar to Channar with the low profile hood covers. The idlers are changed from under the belt without removing the covers.
Figure 32 shows the measured power versus the estimated (calculated) power. The agreement is excellent.
|
Figure 31 - Muja Overland
Conveyor System |
Figure 32 - Muja Overland
Conveyor System |
5.0 NOISE
Engineers are now having to understand noise regulation in the design of the conveyor. Conveyors may pass through residential and farm areas, or residential areas may develop around planned conveyor routes. Operator safety and hearing impairment are also becoming regulation issues. Noise restriction is now becoming a line item in some conveyor design criteria. Noise generation and noise measurement need to be understood. Following are measurements recently taken from the Muja site:
Description
Distance
dBA
1. Conveyor Return Idlers
@ 1m
70-79
2. Chute Transfer
@ 1m
110
3. Chute Transfer
@ 10m
90
4. 25OkW Motor
@ 1m
87
5. 250kw Gearbox
@ 1m
88
6. Electric House Inverters
General
86-87
The idler noise is made of bearing motion, belt slip on roll surface and idler roil weld bead hitting the belt.
The above range of idler noise does not truly reflect audible noise. The handheld instrument measures an RMS value, not peak conditions. Peak values can be significantly higher but not recorded. The weld bead slap can dominate what we hear but not significantly influence the measurement machine.
Noise attenuation, idler roll slap syncopation, and belt flap harmonic coupling with idler weld bead slap need to be studied and standards adopted to guide the designs.
Belt flap is presently reviewed for mechanical loads. Standards for noise emission and control need to be studied and guidelines published to meet coming environmental constraints.
6.0 CONCLUSIONS
Belt suppliers can produce cover rubber compounds with superior rolling resistance properties. Engineering tools can now rank the performance of these new rubber products against their cost and derive significant benefit in overall capital and operating charges.
Splice fatigue strength and efficiency is shown to reach far beyond the industrial standards. Belts have been tested up to ST-8,800 N/mm and achieved a 50% endurance efficiency as set forth in DIN 22110. New materials and methods of analysis make it possible to reliably reduce the steel cord belt safety factor from 6.7 down to 4.5.
Dynamics and controls were briefly reviewed demonstrating that belt elastic stretch can cause control perturbation. The total expected life cycle must be considered in the safety factor calculations.
Belt wear has been successfully controlled by utilizing curved chute technology. Curved chute design is aided by a new ore flow modeling technique called Discrete Element method (DEM). DEM models the particle physics similar to the action of rocks in a flow steam. Collision damage can be quantified for all surfaces. Belt wear classification into measurable abrasion and gouging indices is now possible.
Case studies demonstrate the accuracy of the viscoelastic theory. Z1SCO's 15.6 km successful lame pitch idler spacing (5 m carry side and 1cm return side) is noted.
Noise engineering and standards need to be introduced into conveyor engineering criteria. Present measurement methods may require revision.
REFERENCES:
| 1. |
Spaans, C., "The Calculation of the Main Resistance of Belt Conveyors", Bulk Solids Handling, Trans Tech Publications, Vol. 11, No. 4, pp. 809-826, November 1991. |
| 2. |
Jonkers, Prof. Ir. C. O., "The Indention Rolling Resistance of Belt Conveyors", Frdern und Heben, Vol. 30, pp. 312-318, 1980. |
| 3. |
Hager, M. and Hintz, A., "The Energy Saving Design of Belts for Long Conveyor System" Bulk Solids Handling, Trans Tech Publications, Vol. 13, No. 4, November 1993, pp. 749-758. |
| 4. |
Nordell, L. K., "The Channar 20 km Overland, A Flagship for Modern Belt Conveyor Technology" Bulk Solids Handling, Trans Tech Publications, Vol. 11, No. 4, pp. 781-792, November 1991. |
| 5. |
Nordell, Lawrence K., "The Power of Rubber - Part 1" Bulk Solids Handling, Trans Tech Publications, Vol. 16, Nr. 3, pgs. 333-340, 1996. |
| 6. |
Nordell, L. K., "Steel Cord Belt & Splice Construction: Modernizing Their Specifications; Improving Their Economics" Bulk Solids Handling, Trans Tech Publications, Vol. 13, No. 4, November 1993, pp. 685-693. |
| 7. |
Nordell, L. K., "Steel Cord Splice Design and Fabrication Techniques", Paper presented at AIME-SME Annual Convention Reno, Nevada, February 1993. |
| 8. |
Nordell, L. K., "Particle Flow Modeling: Transfer Chutes & Other Applications" BELTCON 9 conference, RSA, October 1997. |
| 9. |
Nordell, L. K. and Van Heerden, J. J., "Curved Chutes and Other Improvements at the Palabora Mine" BELTCON 8 conference, RSA, October 1995. |
| 10. | Nordell, L. K., "ZISCO Installs World's Longest Troughed Belt, 15,6km Horizontally Curved Overland Conveyor" BELTCON 9 conference, RSA, October 1997. |
| 11. | Lodewijks, G., "The rolling resistance of conveyor belts", Bulk Solids Handling Vol. 15 (1995) No. 1, pp. 15-22 |