| The Power of Rubber - Part 1 |
|
L.K. Nordell
USA
Summary
The power of rubber is commanding special respect for its importance to belt conveyor design and performance.
Cover rubber rolling resistance, energy consumption theory, laboratory investigation and field measurement validation surveys are presented in Part I. This shows new procedures to test rubber specimens and
rationalize differences among polymers to meet different environmental applications with important cost benefits.
Conveyor performance can now be predicted accurately!
In Part II of this two part series, splice core rubber compatibility and its dynamic endurance to fatigue
will take on new definition through a presentation of new testing procedures. These procedures quantify differences in the polymer physical properties among manufacturers that can improve their competitive edge, and extend their range of performance to higher belt strengths.
This paper extends information on Conveyor Dynamics, Inc. (CDI) prior work [1] and
[2], providing new findings, methods and recommendations that significantly alter transportation economics of
overland and pipe conveyers through the understanding of their rubber systems.
Fig. 1 is a photograph of the 5 km German Creek curved overland conveyor (Australia), jointly engineered with Barclay
Mowlem Construction Limited. Barclay Mowlem received an Engineering Excellence Award in 1996 from The Institution of Engineers, Australia for their achievements on this modern installation. This paper discusses some of the new technologies applied In
the engineering of this overland belt conveyor.
1. Introduction
Rubber and its polymer substitutes are, next to fuel, arguably the most important products of the modern transportation age. Roughly US$200 billion is spent worldwide
on rubber products each year. Vehicle tires make up the principle share and have guided the development of rubber's applications. By contrast, about US$250 million
is spent annually in the USA on conveyor belting [3]. Even with these exaggerated sums being spent, the
industry's scientific understanding of rubber's behavior is not duly established. These acts are evident from the continuing worldwide exposition in recent bulk solids handling publications of studies in rubber mechanics with respect to belt conveyor systems
[4], [5], [6], [7] and [8].

Fig. 1: 5km German Creek Curved Overland located
in Queensland, Australia
Capital expenditure for most belt conveyor systems is largely governed by the belt component. Its relative value typically ranges from 45% to 65% for medium to large steel cord
belt installations. Due to the economic significance, modern researchers strive to improve belt design methods which translate into cost benefits.
A belt's cover rubber can govern 30% of the belt rolling resistance and therefore is a key factor in overland conveyor design. This percentage will become less significant with rolling efficiency improvements. Until recently, the mining industry and engineering community have been blind to these differences and how to manage the value offered in the product solicitations. A
few belt manufacturers are funding research, seeing the opportunity to wed their superior product performance with new techniques which demonstrate the products true worth to the mining community.
2. Power Equation & Belt Tension
2.1 General Comment
A paradigm shift to classical mechanics methods is being applied in determining belt power and tension. This technology mirrors the procedures used in the automotive
the industry. Experimental investigation is used as a guide post and verification tool to.
Investigate the sensitivity of the many variables. Ultimately, field measurements are used to
corroborate CDI's findings on conventional and pipe conveyor performance.
2.2 Historical Methods
Rolling resistance calculation methods, used by most engineering firms, have not changed in the last 30 years. Empirical coefficients are chosen based on vague details with no
regard for the bolt's physical constants and material properties. The most widely used methods are ISO
5048 [9], DIN 221O1 [10], and CEMA [11].
ISO 5048 and DIN 22101 combine all rolling losses into one drag resistance coefficient
(f). This coefficient varies between 0.017 and 0.025 depending on generalities of the installation, such as installation accuracy, maintenance, and severity of use. Downhills are treated in a different arbitrary manner. The value of
"f" is not based on any scientific measure, and its selection is quite arbitrary. The engineer's method of selecting
"f" is based on experience and on published data. ISO and DIN have three variables which alter the rolling resistance: a) the value of
"f" , b) material and belt weight per unit of length, and c) a temperature compensation factor. CEMA adds: a) belt tension, b) idler
spacing, c) idler drag, and d) parasitic losses (pulleys, scrapers, material acceleration, and
skirtboards).
2.3 Modem Power Equation
Adequate description of modern rolling resistance formulae must include the additional features of [2]:
- belt speed rubber excitation frequency)
- belt trough shape (belt-idler pressure distribution along contact surface)
- ore load configuration or shape and % loading (pressure distribution)
- belt cover thickness top and bottom (bottom only with turnovers)
- idler roll diameter and spacing (carry and return)
- Cpv: vertical curve pressure (convex increase; concave decrease
belt force on idler)
- Cph: Horizontal curve pressure (increase force on idler)
- rubber viscoelastic properties:
- E'
: tensile/compression
dynamic modulus (spring)
- E"
: tensile/compression loss or viscous modulus (dash pot)
- G'
: shear dynamic modulus (-spring)
- G"
: shear loss or viscous modulus (dash pot)
- ε : strain dependent on temperature, deformation
frequency, and E', E", G', G"
- βm : belt bending stiffness modulus (longitudinal and transverse for conventional belt and for pipe belt)
- Mx:
rubber master curve incorporating all viscoelastic properties referenced at zero
degrees Celsius
As stated earlier, the rubber can constitute 60 - 70% of all rolling losses. This loss has three components using the CEMA ky rolling resistance convention:
CEMA ky = ky1 + ky2 + ky3
(1)
(Note: CEMA does not separate these variables)
|
ky1 :
|
idler roll indention into belt rubber |
|
ky2: |
belt flexure between idler stations |
|
ky3: |
ore agitation or trampling shape change between idler stations |
The CEMA kx idler drag losses are still treated separately, unlike the
ISO and DIN method.
Figs. 2, 3 and 4 are borrowed from a previous paper [1].
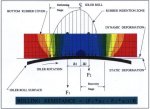
Fig. 2 schematically illustrates the idler roll indention into the belt cover. This is an approximation to the true complex form. The asymmetric pressures about the centerline can be resolved into a force to spin the roll
(ΔF):
ΔF = (F1
a1 - F2 a2)/r
(2)
where:
i = 1. 2 - left side, right side
Fi = total force acting on either side of center idler
ai = distance of force centroid from idler center
r = idler radius
The rubber excitation frequency half cycle is given by the belt velocity divided by the length of contact between belt and
idler. Color bands represent the distribution of normal stresses developed by the initial static loading before rotation of the idler. As the idler rotates, the rubber cannot
instantly recover, thereby shortening the exit contact length causing an imbalance between incoming and exiting contact zones with respect to the idler
centerline.
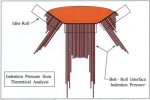
Fig. 3 illustrates the generic pressure distribution of idler indention into the belt cover for loss
ky1. This is based on a theoretical equation. Similar pressure patterns have been measured [12].
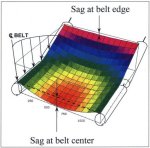
Fig. 4 illustrates the belt and ore shape change between idler supports for losses
and the details are omitted from this paper for brevity.
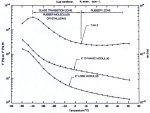
Fig. 5 is taken from [2]. This demonstrates the rubber viscoelastic properties E',
E" which only vary with temperature (-50 C to +50 C). The excitation
frequency is fixed to one value. The measurement device is explained in an earlier paper
[2].
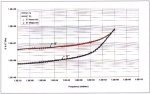
Fig. 6 illustrates a rubber master curve for a belt cover compound. The E',
E" values are plotted against frequency. Frequency and temperature are inversely proportional to each other and can be combined through a transformation function [13]. By producing
many frequency sweeps for each 5 C temperature increment, this master curve can be generated by the transformation function. The hundred plus
E', E" data points are curve fit by a special process that leads to the curve fit shown. The master curves are generated for a range of strains (1-7%) that meet most operating conditions, except for pipe conveyors.
The CDI compression idler indention rubber energy loss equation,
ΔF, for steel shell idlers is based on the following criteria: (Note: G',
G" influence is omitted for brevity.)
- E': f(T,ε,
ω);
ω
= f(T,
ε, b,
δ);
b = f(T,
ε, E',
δ)
- σ(t) =
σ0 sin (ωt);
ε(t) =
ε0 sin (ωt -
δ);
(3)
- σ0 = E' (ε0)/cos δ = E"(ε0)/sin
δ
(4)
- ΔF = 0∫w 0.5π[E"]l[E']m
Pn [t0/d2/3] q(w)n dw (5)
- Hertz =
ω/2π = 2b/v
= contact
cycles
(6)
where:
T : belt cover
thickness in contact with idler
l, m : exponential coefficient for
viscoelastic properties
n : exponential
coefficient for trough shape
o: exponential
coefficient for depth of belt cover
ε0: maximum strain
amplitude in contact region
ε(t): strain dependent on
time
σ: rubber stress in
contact region
σ0: maximum stress
amplitude in contact region, per Fig. 2
σ(t): stress dependant on time
ω: frequency of rubber
excitation
b : contact length of rubber
with idler roll diameter (d)
δ: stress-strain phase angle
tan-(E' /E")
d : idler roll diameter
v : belt speed
P n: P is a belt shape or
form factor
q (w)n: load force applied across idler face
per Fig. 3
dw : differential increment across idler
face
w : idler face width
ΔF: belt line force required to spin the
idler roll.
The solution to this non-linear equation and its sub-functions is complex, tedious, and proprietary. The original form is an extension of
SPAANS [5) and JONKERS [6] work at Delft and Twente Universities in the Netherlands.
2.4 Experimental Measurement Verification
Syncrude Canada Ltd. contracted CDI to develop a belt conveyor power equation based on a two-body viscoelastic model.
Syncrude mines oil sand in the Athabasca region of northern Alberta,
Canada. The temperatures run the extremes Of -55 C to +40 C. The
idlers are rubber covered with a corrugated (sinusoidal) pattern. The two-body viscoelastic equations were developed in about 2 years. A belt rolling resistance mechanical model was built to test the theory.
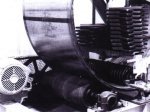
Fig. 7 shows the experimental machine. A belt is placed on the drum inside. The idler imparts a force by the stacked weights at programmed increments. The drum is rotated by the external support rolls at programmed speeds. Strain gauge links measure the resistance to idler rotation with proper allowance for bearing losses. The assembly is placed in a cold chamber for temperature range testing.
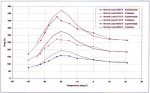
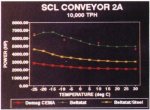
Figs. 8 and 9 show results of measurements and the theoretical curves for a range of forces (tonnage) and temperatures at one
belt speed. Fig. 8 is the drag loss with a rubber corrugated idler. Fig. 9
is for a flat face rubber coated idler roll using the same rubber compound.
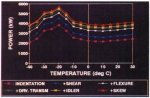
Fig. 10 illustrates the theoretical combined rolling losses from idler compression indention, rubber idler-belt shear
action, belt and ore flexure, drive transmission, idler bearing and seal drag, and idler alignment
skew. As shown, the idler indention (compression, shear) and flexure contribute over 80% of all
losses.
Note that the rolling resistance reaches a peak at about -22 C. Below this temperature the rolling resistance drops. At -40
C, the loss is below most much higher temperatures. This is due to rubber molecular crystallization. The belt
manufacturer experimented with special compounds for many years to produce a material that could withstand extremes
of cold weather and oil sand absorption.
2.5 Field Measurement Verification
Final proof of the equation's veracity is by field measurements. Five conventional conveyor systems and a group of eight pipe conveyors are commented on:
- Syncrude Canada Ltd., 2 kin, Canada, 1990-1994
- Kennecott Bingham Canyon overland. USA, 1987-1995
- Hamersley Iron, 20 km Channar overland, Australia, 1989
- Shell Oil. 5km German Creek. Australia, 1995
- Western Power, 3.6 km overland, Australia, 1996
- Pipe Conveyors, up to 2.5 km, Asia, USA. 1996.
2.5.1 Syncrude (10,000 t/h, 3700 kw, 2 km)
Syncrude field measurements were taken over 3 years. Torque was measured on the drive pulley low speed shaft to eliminate reducer and motor
errors. Weigh scale readings mapped the load pattern. Fig. 11 shows tour measurement points
from -25 C to +30 C. The average error of the theory with field measurements is 5%. The graph shows a comparison with CEMA prediction, at 100% error. Syncrude uses catenary style idler rolls. Their alignment error was incorporated into the
prediction.
BELTSTAT/Steel denotes the evaluation of a steel shell idler without rubber covering. This result is close to the plain rubber covered roll shown in Fig. g, BELTSTAT is the
trade name of the CDI belt conveyor computer program.
2.5.2 Bingham Canyon (9.000 t/h, 4500 kW, 2.6 km and 4.4 km)
CDI took field measurements during commissioning, and these were later followed by further Kennecott measurements, The average error was 7% between empty and full belts over different temperature conditions.
2.5.3 Channar (2200 t/h. 2100 kW, 10 km x 2 flights)
Extensive field measurements, using DC drive kW and weigh scale values, verified the theory to be within 5%. The conveyor has been
running for 7 years. Today the demand power continues to drop. During
commissioning, the equivalent DIN "f" = 0.010. Today the factor approaches
f = 0.0085. To my knowledge, this Channar overland has the lowest rolling resistance of any conveyor, conventional or cable
belt type.
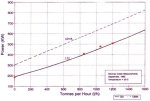
2.5.4 German Creek (1600 t/h, 840kW, 5km)
Drive shaft torque readings and weigh scale values provided the verification. Fig. 12 shows
four measured values at different loads and the theoretical prediction. The average error is less than 2%. The CEMA values are also given for
comparison, The CDI and CEMA curve values represent separate power and belt selections. Note, the CEMA value is about 29% higher than the true value.
The conveyor was divided into 126 sections to represent all geometric variations together with drives and
take-up system. Table 1 illustrates the minimum (1) and maximum (2) strain
(STRN), rubber excitation frequency in units (FREQ rad/s and Hertz) for the first 10 flights (Fig. 3:
Eq. (6)).
Note, the minimum strain is about 0.5% and the maximum is about 4%. The rubber excitation frequency is 586 Hz at 0.5% strain and 220 Hz at 4% strain. The
FREQ (rad/s) illustrates how to use the master curve in Fig. 6. The FREQ value, combining temperature and speed, provides the independent variable for
E' and E" selection.
Table 2 illustrates the itemized division of power losses for CEMA and the viscoelastic
(CDI) method. The CEMA value (784 kW) differs from the above curve due to the lower ST rating for the belt, which is referred to the CDI
viscoelastic design. Note, the total viscoelastic losses equal 69% (items 1, 2. 3 and 4). the
lift is 15%. the idler losses 10%, and the remainder equal about 6%.
2.5.5 Western Power (600 t/h, 440 kW, 3.6 km, 3.5 m/s)
A belt manufacturer provided field measurements and the conveyor's design data. Field measurements, for a specific operating condition, gave a demand power of 283 kW. Using the manufacturers rubber master curve and conveyor data, we calculated 295 kW (4% error).
2.5.6 Pipe Conveyors
For the eight pipe conveyors studied, the maximum error power was 10%. This included fabric
and steel cord installations. empty and loaded, some with many curves. We found that most pipe conveyers consume about half the full bolt demand bower when
running empty.
2.6 Additional Notes
2.6.1 Idler Roll Diameter Influence
Larger idler roll diameters can provide substantial reduction in power on equivalent horizontally running conveyors. From
Eq. (4) the idler roll indention power sensitivity can be found. These values are given in
Table 3.
2.6.2 Viscoelastic Testing Procedures
There are many different types of test machines that claim to produce the conventionally
defined viscoelastic properties. Unfortunately, few machines can replicate E',
E" values for the same temperature, frequency and strain. There is no industrial standard compound and viscoelastic properties
with which comparisons can be made. We have submitted rubber test samples to other laboratories specifying the
E', E" data. Applying other laboratory data to our power constitutive equations has not provided meaningful results. This is an area of general interest and concern among professional
rheologists in trying to establish common test standard.
Table 1: Cover rubber indention strain and frequency (min/max) for the first
10 flights of German Creek Overland
| FLT # |
STRN # |
FREQ1 rad/s |
STRN2 |
FREQ2 rad/s |
Hz1 |
Hz2 |
| 1. |
0.47 |
0.1264E+03 |
3.26 |
0.5268E+02 |
0.5859E+03 |
0.2442E+03 |
| 2. |
0.29 |
0.1286E+03 |
1.76 |
0.7375E+02 |
0.7813E+03 |
0.3418E+03 |
| 3. |
0.50 |
0.1264E+03 |
3.57 |
0.4741E+02 |
0.5859E+03 |
0.2197E+03 |
| 4. |
0.58 |
0.1264E+03 |
3.93 |
0.4741E+02 |
0.5859E+03 |
0.2197E+03 |
| 5. |
0.58 |
0.1264E+03 |
3.93 |
0.4741E+02 |
0.5859E+03 |
0.2197E+03 |
| 6. |
0.58 |
0.1264E+03 |
3.93 |
0.4741E+02 |
0.5859E+03 |
0.2197E+03 |
| 7. |
0.58 |
0.1264E+03 |
3.94 |
0.4741E+02 |
0.5859E+03 |
0.2197E+03 |
| 8. |
0.58 |
0.1264E+03 |
3.96 |
0.4741E+02 |
0.5859E+03 |
0.2197E+03 |
| 9. |
0.59 |
0.1264E+03 |
3.98 |
0.4741E+02 |
0.5859E+03 |
0.2197E+03 |
| 10. |
0.50 |
0.1264E+03 |
3.57 |
0.4741E+02 |
0.5859E+03 |
0.2197E+03 |
3. Economics of Rubber Selection
Belt cover viscoelastic properties for horizontal running overlands control the specifications of belt strength, motor an reducer sizes, pulley and structural supports, and operating
cost. An example offered that demonstrates the sensitivity of the cover rubber selection to the
next present value (NPV) cost of these main components. Fig. 13 is a graph of
the power required to operate the German Creek 5 km overland at its design tonnage of 1600
t/h. The CEMA power equation. and alternatively three different belt compounds
(C-1. C-2, and C-3) are studied with their respective powers based on the viscoelastic
equations. These three compounds are installed today in different parts of the world.
The study represents their range of yearly operating temperatures and yearly hours at
full production. The power calculations are based on actual rubber master curves. The German Creek compound is not included in this group.
| Item |
Description of loss |
CEMA |
CDI |
| kW |
% of Total |
kW |
% of Total |
| 1. |
Idler/Belt indention loss |
|
|
|
|
| Belt rheology |
0 |
0 |
310.7 |
48 |
| Idler roll rheology |
0 |
0 |
0 |
0 |
| 2. |
Idler/Belt shear loss |
|
|
|
|
| |
Belt G' |
0 |
0 |
0 |
0 |
| Idler roll G' |
0 |
0 |
0 |
0 |
| Idler diameter variation |
0 |
0 |
0 |
0 |
| 3. |
Material flexure (/Tym) |
411.7 |
52 |
47 |
7 |
| 4. |
Belt flexure |
|
|
|
|
| Carry Side (Tyc) |
96.4 |
12 |
70.5 |
11 |
| Return side (Tyr) |
82.1 |
10 |
20 |
3 |
| 5. |
Conveyor misalignment |
0 |
0 |
0 |
0 |
| 6. |
Drive transmission loss |
25 |
3 |
23.4 |
4 |
| 7. |
Idler losses - carry side |
|
|
|
|
| Coulomb friction |
21.3 |
3 |
21.3 |
3 |
| Seal Drag |
29.8 |
4 |
29.8 |
5 |
| Viscous drag |
0 |
0 |
0 |
0 |
| 8. |
Idler losses - return side |
|
|
|
|
| Coulomb friction |
4.3 |
1 |
4.3 |
1 |
| Seal Drag |
6.7 |
1 |
6.7 |
1 |
| Viscous drag |
0 |
0 |
0 |
0 |
| 9. |
Material lift (Tm) |
94.2 |
12 |
94.2 |
15 |
| 10. |
Material acceleration (Tam) |
3.6 |
0 |
3.6 |
1 |
| 11. |
Pulley friction (non-drive) |
0.9 |
0 |
0.9 |
0 |
| 12. |
Accessory friction |
|
|
|
|
| -skirtboard |
3.3 |
0 |
3.3 |
1 |
| 13. |
Accessory friction |
|
|
|
|
| -belt cleaners |
5 |
1 |
5 |
1 |
| 14. |
Total |
784.3 |
100 |
640.7 |
100 |
Fig. 14 is a graph of the percentage of the number of hours at each temperature recorded for the year based on a 24 hour day. The temperature ranges
from -10C to +45C.
| Rubber
Indention Power Reduction: 1 - (d1/d2)2/3 |
Roll
Diameter
(d1) mm |
Roll
Diameter (d2) mm |
| 127 |
133 |
152 |
159 |
178 |
219 |
| 127 |
- |
0.030 |
0.113 |
0.139 |
0.201 |
0.305 |
| 133 |
|
- |
0.085 |
0.112 |
0.177 |
0.283 |
| 152 |
|
|
- |
0.030 |
0.100 |
0.216 |
| 159 |
|
|
|
- |
1.073 |
0.192 |
| 178 |
|
|
|
|
- |
0.129 |
| 219 |
|
|
|
|
|
- |
The equivalent motor demand power is derived summing the multiple of the temperature dependent power
kW(t) by the frequency at each temperature f(t).
| |
+45C |
|
| Equivalent Power = |
∑ |
kW (t) x f(t) |
| |
t = -10C |
|
This resolves to:
|
Equivalent Power
(-10 C to +45 C)
|
|
CEMA |
935 kW |
|
C-1 |
920kW |
|
C-2 |
703 kW |
|
C-3 |
625 kW |
To derive the NPV power cost for a ten year operating period, we assume the following:
|
kilowatt cost: |
US$0.10/kWh |
|
value of money: |
8% |
|
operating hours: |
3.500 h @ full design load/year |
|
NPV (8%; 10 yrs): |
7 times multiple of 1st year |
The NPV 10 year power costs are then (US$O.10 kWh x 3500 h/year x 7 = US$2450/kWh
/10 yrs):
|
NPV Cost |
|
CEMA: 935 kW x
$2450/kW |
$2,290,750 |
|
C-1: 920kW x
$2450/kW |
$2,254,000 |
|
C-2: 703kW x
$2450/kW |
$1,722,350 |
|
C-3: 625 kW x
$2450/kW |
$1,531,250 |
The drive assembly size and belt strength is dependent on the peak power. The peak power for each condition is:
|
Condition |
Power |
Belt ST
(N/mm) |
|
CEMA: |
990kW
@-l0C |
1643 |
|
C-1: |
1065kW
@+45C |
1760 |
|
C-2: |
783kW
@+45C |
1294 |
|
C-3: |
838kW
@-l0C |
1403 |

The total, belt affected, system cost and operating cost can now be estimated. Assume the drive assembly cost is roughly estimated at
$300/kW. This summary includes an estimate for belt, pulleys. and drives as above.
|
Condition |
Equipment
Cost |
NPV Operating
Cost |
Total Cost |
|
CEMA: |
$2,079,755 |
$2,290,750 |
$4,370,505 |
|
C-1: |
$2,149,493 |
$2,254,000 |
$4,403,492 |
| C-2: |
$1,869,676 |
$1,722,350 |
$3,592,026 |
| C-3: |
$1,932,665 |
$1,531,250 |
$3,463,915 |
Arranging these costs in percentage terms:
|
Condition |
Equipment
Cost |
NPV Operating
Cost |
% wrt
C-3 NPV |
|
CEMA: |
48% |
52% |
126% |
|
C-1: |
49% |
51% |
127% |
| C-2: |
52% |
48% |
103% |
| C-3: |
56% |
44% |
100% |
The operating cost, for this example, is of the same magnitude as the capital expenditure. Thus, compound
C-3 would reduce the capital and operating cost over ten years by 27% over compound
C-1.
A shift in the temperature histogram can significantly alter this outcome,
4. Conclusion
Applying modem rubber technology can lead to substantial commercial improvement in the transportation systems cost and can leverage its
recommendation over alternative transportation means. Many rubber manufacturers are aware of the new evaluation process and are striving to likewise be at the forefront wit the engineers to claim their rightful advantage for value provided.
Their advantage will become more apparent in the near future as these techniques gain acceptance of owners and operators. Let's put the POWER HOGS
in their rightful place.
Acknowledgments
The author thanks Dr. XIANGJUN "JOHN" QIU. CDI's Manager of Applied Mechanics, for the depth and breadth of his contributions to our rubber research program.
I further extend my deep appreciation to Prof. MANFRED HAGER for Hannover's excellent research
work [7], which is the keystone to worldwide acceptance of these new techniques.
References
[1] NORDELL, L.K.: Rubber's impact on belt power, strength and life -Understanding rubber properties in conveyor design; BELTCON 8, October 1995.
[2] NORDELL. L.K.: The Channar 20km overland - A flagship for modern belt conveyor technology; bulk solids handling Vol. II (1991) No.4, pp. 781-792.
[3] SOWA, S.: Heavy-duty belting digs up growth: Rubber & Plastics News,
pp. 12-13. June 17,1996.
[4] GREUNE. A. and HAGER. M.: The energy-saving design of belt conveyors: bulk solids handling Vol. 10 (1990) No, 3. pp.
245-250.
[5] SPAANS, C.: The calculation of the main resistance of belt conveyors:
bulk solids handling Vol. 11 (1991) No. 4. pp. 809-826.
[6] JONKERS, C.: The indention rolling resistance of belt conveyors: Frdern
und Heben, Vol.13 (1980) pp. 312-318.
[7] HAGER, M and HINTZ, A.: The energy-saving design of belts for long conveyor systems; bulk
solids handling Vol. 13(1993) No. 4. pp. 749-758.
[8] LODEWIJKS, G.: The rolling resistance of belt conveyors; bulk solids handling Vol.
15 (1995) No. 1. pp. 15-22.
[9] International Standard ISO 5040: Continuous Mechanical Handling Equipment: First Edition, 1979.
[10] German lndustrial Standard: Belt Conveyors for Bulk Materials. DIN
22101.1982.
[11] Conveyor Equipment Manufacturers Association (CEMA) (USA): Belt Conveyors for Bulk Materials; Third
Edition, 1988.
[12] GRABNER. K., GRIMMER. K.-J., and KESSLER, F.: Research into
normal forces between belt and idlers at critical locations on the belt conveyor
track; bulk solids handling Vol. 13 (1993) No.4, pp. 727-734.
[13] WILLIAMS, M., LANDEL. R. and FERRY, J.: The temperature dependence of
relaxation mechanisms in amorphous polymers and other glassforming liquids; J. Amer.
Chemical Society, Vol. 77. July 1955.