Fig. 1: Sample CBM scan data
C.A.T.™ Scanning of Belting
Section 1: - Introduction
The condition of the cords within any steel cord belt is crucial to the safe, long term operation of that belt. A new SC belt scanning system, the Belt C.A.T.™ utilises state-of-the-art data acquisition equipment and software to provide belt operators with all the information required to assess the condition of BOTH the belt carcass and splices. The processed Belt C.A.T.™ data provides a coloured graphical image of any cord damage, this image directly reflecting the magnitude of the cord damage, as well as showing its precise lateral and longitudinal location in the belt. Splice analysis is also simplified, as the Splice Graphics that are produced show the location of every cord end in the splice.
A scanning service utilising the Belt C.A.T.™ system has been commercially available since mid-1997, with some 40 scans having been performed around the world since that time. Examples of the data obtained from these scans are presented in this article to demonstrate the advanced capabilities of the system, and to show the "user-friendly" nature of the data that are produced.
Section 2: - Steel Cord Belt Scanning History
In order to truly appreciate the advanced nature of the Belt C.A.T.™ system, a very brief history of SC belt scanning must be presented. Steel cord belt scanning became commercially available in the mid-1980s, with a system known as the Conveyor Belt Monitor (CBM). This system "preconditions" the steel cords by running the belt through a magnetic field. Once magnetised, any cord damage or discontinuity will create a small voltage as it passes over a sensing transducer, consisting of 2 or more coils. The output of the transducer is directed to a chart recorder, where the voltage fluctuations caused by the cord damage will result in a series of transient(s) on a strip of chart recorder paper. Fig. 1 shows a typical output from this system, including the splice signature commonly produced by a 2 step splice.
Other SC scanning systems have surfaced over the last 10 years that use eddy-current and other magnetic technologies; however, virtually all of these systems present the data in a manner that is similar to the CBM system, a series of lines on a length of chart paper. Also the data from all of these systems must be calibrated and interpreted by a well-trained technician for the results to be of any value to the average SC belt operator.
The data obtained from the Belt C.A.T.™ system is presented in a far more "user-friendly' format, providing the client with a visual graphic of all pertinent data. This is a result of the proprietary data processing software developed by Conveyor Belt Technology (CBT) which allows data to be presented in the form of the "Conveyor Trace", a sample of which is shown in Fig. 2.
This "trace" is, in effect, a representation of the fall width of the belt, clearly depicting the left and right edges of the belt. Any cord damage, cord discontinuity or corrosion is represented by a coloured graphical image on the trace, with the precise lateral and longitudinal location, and magnitude of every cord fault corresponding directly to the size of the coloured image on the trace. Using the Belt C.A.T.™ imaging process, a graphical image of every splice is produced, clearly displaying the location of virtually every cord end within each splice.
In addition to its graphical imaging system, the Belt C.A.T.™ system has been designed to be immune to the variables that can severely influence data from other scanning systems: belt speed variations, belt flap and outside EMF interference.
Fig. 1: Sample CBM scan data
Fig. 2: Typical Belt C.A.T.™ scan data
Section 3: - Belt C.A.T. Data Presentation
The Conveyor Trace is the "general summary" of the overall condition of the conveyor belt, providing an overview of the full belt for 1 revolutions. All splices and any locations of cord damage (faults) are clearly shown and identified on the trace. The trace is to be viewed as if one were walking down the belt on the carry side against the direction of belt travel. If no cord faults exist then one will see a blank (white) belt between the black lines that represent the belt edges. When cord damage occurs, the fault is indicated by a coloured image, with red indicating a loss of steel mass and green indicating an increase of mass. Therefore, the cord ends of a single short length of missing cord as shown in Fig. 3a would produce the graphic image on the Conveyor Trace shown in Fig. 3b. This coloured graphical imaging process is the basis for all of the Belt C.A.T. data.
Fig. 3a: Actual belt with cord missing
Fig. 3b: Conveyor Trace Graphic
A short section of the Conveyor Trace from a typical conveyor is shown in Fig. 4.
Fig. 4: Typical Conveyor Trace
All locations of significant damage are identified on the trace, and a Fault Graphic is provided for each. This is an enlargement of the area, including a description of the damage, plus any specific recommendations. The fault graphic for fault 2 is shown in reduced form in Fig. 5. Fig. 6 shows the most common types of cord faults and the resulting images that will appear on the Conveyor Trace. Since the width of the image in the Conveyor Trace corresponds to the actual width of cord damage involved, calibration inspections are not required. The wider the image on the Trace, the more cords that are damaged. The precise longitudinal and lateral location of the damage are also depicted by the Conveyor Trace.

Fig. 5: Belt Fault Graphic
| Fault No.: | 2 |
| Location: | 25 metres leading splice 2 |
| Belt Width Involved: | 15% of the belt |
| Cover Damage: | Not inspected |
| Interpretation: | Site of severe damage to the extreme right edge of the belt |
| Comments:
The area involves approximately 15% of the belt width. It is recommended that the area be located and the condition of the damage be assessed. Any loose cord ends should be removed. At the next available opportunity, the area should be removed from the belt and the belt be respliced. See Sections 2.2 and 4.3 for a detailed discussion of the removal of the damage. |
|
The best evidence of the X-ray like format of the Belt C.A.T. data comes from a belt that contained some very severe damage immediately adjacent to one of the splices. Due to the extent of the damage, the splice was removed very shortly after the scan. The section of belting was taken to the CBT shop and the rubber cover removed. Fig. 7a below shows the Belt
Fig.6: Common faults and the resulting Conveyor Trace graphics
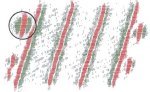
Fig.7a: Belt C.A.T. graphic
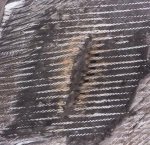
Fig.7b: Photograph of circled Area

Fig.8: Edge damage
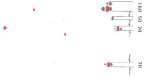
Fig.9: Multiple damage
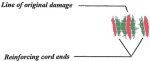
Fig.10: Repair with reinforcing cords
C.A.T. splice graphic, while Fig. 7b is a photograph of the largest area of damage - circled in the splice graphic.
Figs. 8 and 9 are some typical examples of faults that have been identified in recent scans. Fig. 8 involves damage to several cords at both belt edges, with damage to a single cord in the centre of the belt. Fig. 9 is of a location where a number of small /intermediate faults occur within a belt length of less than 1 m. Although the individual locations of damage are small, each involving less than 5% of the belt width, the fact that they occur in such a short length of belting results in the areas becoming additive. Thus, the overall damage at this area would be considered to involve over 25% of the belt width, and should be removed.
Fig. 10 is a typical example of a fault where the original damage has been repaired with a hot-vulcanised repair, and reinforcing cords have been installed in the repair. The original damage is in the centre, with the ends of the reinforcing cords at each end of the graphic. As a side note, many SC belt operators are not aware that the installation of reinforcing cords into a repair does not reinstate the belt back to its rated tension. These cords merely provide an extra measure of protection for the repair in the event of an abnormal impact or condition.
Section 4: - Belt C.A.T. Splice Graphics
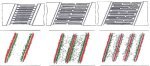
Fig. 11: Typical splice constructions and the associated Splice Graphics
4.1 Splice Construction Verification
Steel cord belt splices are the weakest point in any steel cord belt. Therefore, it is important to ensure that new splices have been constructed according to the belt manufacturer's specifications. Due to its unique graphical imaging process, the Belt C.A.T. provides an X-ray like image of the cord ends within a splice. Fig. 11 shows the typical construction of 1, 2 and 3 step splices, with the corresponding splice graphics that have been obtained from properly constructed splices.
In the past, once a steel cord splice was closed and vulcanised, there was no simple method of confirming that the splice had actually been properly constructed. Only through a series of X-rays could one identify the location of all the cord ends. This is a very expensive and dangerous operation, requiring lengthy conveyor downtime.
However, this has all changed with the Belt C.A.T. Splice graphics can now be obtained from any belt while the belt is fully operational, i.e. the belt operating at full speed and transporting material. Less than 1 0 minutes of system downtime is required to install the Belt C.A.T. scanning equipment. Numerous examples of poorly constructed new splices have been identified during belt commissioning scans performed in the past 12 months.
For example, the cord lay-up in the 3-step splice in Fig. 12 is unacceptable. Firstly, there is a very significant variation in the step lengths, particularly in the trailing stop. Furthermore, there were 2 people, with different SC splicing experience involved in constructing the splice. In the right of the splice, the cord end butts along the intermediate step lines are staggered, as is sometimes specified by the belt manufacturer. However, in the left of the splice, all of the cord butts are in-line along the step lines. One of the splicing crew was NOT following the belt manufacturer's cord lay-up instructions!

Fig. 12: Poorly Constructed splice

Fig. 13: Poorly Constructed splice
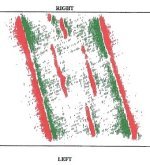
Fig. 14: Poorly constructed splice

Fig. 15: Poorly constructed splice
The splice shown in Fig. 13 is also considered to be poorly constructed. The centre step varies significantly across the width of the splice.
The splice in Fig. 14 is one of the most unusual splice constructions ever encountered. The centre of the splice has been constructed to a 3 step pattern, while the left and right sections of the splice are constructed to a 2 step pattern.
The improper cord installation in all of these splices will cause uneven tensions to occur within the splices, resulting in belt tracking problems and most likely to a premature failure of the splice.
Section 5: Failing/Damaged Splices
Although belt manufacturers attempt to design splices such that they should last as long as the belt, splices deteriorate over time, and failure can occur, particularly if there is cord damage or loss of the cord/rubber adhesion within the splice. Regular scanning can identity splices that may have weakened to the point that they pose a real and serious threat to the continued safe operation of the belt.
The splice graphic reveals anomalies along both the leading and trailing step lines in the left/centre section of the splice shown in Fig. 15. The splice graphic indicates that there had been some movement of the cord ends at these locations, suggesting a possible loss of rubber adhesion had occurred within the splice. Subsequent inspection of the splice revealed several bulges at both locations, a sure sign of impending splice failure.
Section 6: Conclusion
In the first 12 months of commercial operation, the CBT Belt C.A.T. scanning device service has been very positively accepted by operators of steel cord belting around the world. Its unique graphical imaging system allows for precise analysis of any cord damage within the belting or problems within the splices.
The scanning of SC belting, whether old or new, is a maintenance tool that will provide detailed information on the current condition of the complete belt and splices. From this initial data, a short term maintenance program can be established, and the removal of any serious damage can be performed at regular intervals, allow the belt operator to monitor and assess the belt ageing process, thereby maximising the safe operational life of the belt.
Ideally, any steel cord belt should be scanned when new, as part of a complete belt audit, to ensure that all components of the belt are acceptable, and that no damage has occurred during transport or installation. Subsequent scans at regular intervals will provide comparative data which will allow any problems that may occur within the system to be identified and corrected easy in the life of the belt.
![]()