|
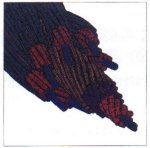
Fig. 1: Wire Rope Construction - Palabora ST 6600 N/mm belt with 12.4mm diameter cable |
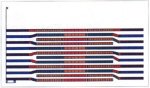
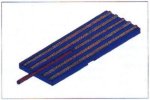
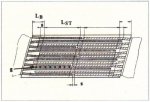
Fig. 2: FEM element and cable arrangement - 3 step splice patter 213- |
A Belt Conveyor Steel Cord Splice Analysis Using Finite Element Methods
L. Nordell, X. Qiu, and V. Sethi, USA
Summary
Owners and operators of large material handling installations are questioning the proficiency of engineers to set accurate, up-to-date, splice design criteria for steel cord belt conveyors. Costly splice failures have occurred repeatedly in belts where engineers and installers have not set the appropriate guidelines or standards during manufacturing and installation, This concern is emphasized when safety is questioned, especially as belt breaking strength exceeds St 6000 N/mm and/or where the belt service factor is reduced below SF = 6.0:1 At the higher belt strengths, the dynamic splice efficiency is reduced [1]. Improper coordination of cable diameter, cable pitch, and splice schematic will lead lo further reduction in the belt's temporal performance. Little has been published on the critical elements which contribute to the splice design and installation procedure, and to the appropriate criteria for rejecting a design or installation. Some of these critical factors are discussed here. This presentation is an overview of results to date, and the areas presently under investigation. This is not a definitive assessment of splice design, but we present a suggestion for new treatment, witch updates the well recognized standards of DIN 22101, DIN 22131, and other industrial standards in use.
1. Introduction
Conveyor Dynamics, Inc. (CDI) has developed a method of analyzing the steel cord belt conveyor splice using the finite element method (FEM) from ANSYS [2] In this paper, a discussion is presented on the procedures followed to develop and vent, the three dimensional (3-D) FEM model, including wire rope modeling, isotropic hyperelastic non-linear rubber modeling, H-block simulation, and experimental splice testing. The FEM analysis will improve the understanding of splice failure mechanisms and splice schematic dimensional sensitivities, and provide insight on improvements in splice efficiency and quality controls in manufacturing. The study may provide methodology for altering the core rubber compounds and cable design.
As pointed out by Flebbe [1], DIN 22101 formulates a restrictive assessment on belt rating based on the belt service factor. Unfortunately, at present, it is the guideline to which operators and consultants can refer in lieu of their own independent research, or those of universities [3], and manufacturers [1, 4]. New criteria must be developed to provide engineers with qualified methods that account for the recent findings and practices In high strength and low service factors, such as in the mines listed in Table 1.
Location Belt Strength SF Tested Splice
Dynamic EfficiencySupplier Selby 1983 St 7000 N/mm 5.0:1 N/A BTR Chuquicamata 1985 St 6600 N/mm 7.0:1 N/A Goodyear/Clouth Prosper Haniel 1986 St 7500 N/mm 5.5:1 38% Phoenix Palabora 1988 St 6600 N/mm 6.5:1 50% Continental Channar 1989 St 3000 N/mm 5.0:1 58% Continental Table 1: Mines with high strength and low service factored belts with respective tested splice efficiency
2. ANSYS and the Computer
The ANSYS finite element software program [2] is a modified version 4.4. The program can handle up to 5.000 wave front degrees of freedom.
A typical splice model will take about 8,000 elements and 20,000 nodes. The program can model non-linear hyperelastic and composite materials. The ANSYS program is provided on a UNIX platform. CDI is running the program on an IBM RS/6000 RISC workstation.
The computer is equipped with 48 MB of memory, uses three hard disks totaling 1.2 GB of memory, and has a 2.3 GB streamer tape backup. The computer computation power is rated at about 33 MIPS and 10 MFLOPS. A typical non-linear analysis takes between 30 and 50 hours of dedicated computation time.
3. Wire Rope Modelling
The wire rope is analyzed as an extruded double helix with the specified wire filament diameters and helix lay lengths for all strands as shown in Fig. 1. The cable shown is the design for the St 8600 N/mm belt on the Palabora (RSA) conveyor [5]. The tensile elongation. coupling with the resulting torsional twist and bending flexure are computed from a CDI program developed on the principles of Costello [6]. A special CDI defined element was then developed for ANSYS. This element provides the properties of wire rope behavior with the correct geometry. and coupling behavior between elongation and torsion, and reduced bending stiffness. The element provides correct node-to-node interfacing with the ANSYS brick (rubber) hyperelastic element. The right and left lay cable patterns are accounted for in the splice. In Fig. 2, a cable pattern is illustrated for a 213- (3 step) splice sequence. The alternating color sequence from the g cables of each end denotes the alternating lay patterns. The differing color patterns denote individual elements in use. The width of the splice plot has been exaggerated for clarity.
|
Fig. 1: Wire Rope Construction - Palabora ST 6600 N/mm belt with 12.4mm diameter cable |
Fig. 2: FEM element and cable arrangement - 3 step splice patter 213- |
4. Rubber Modelling
The model described is fully three dimensional. The ANSYS program has a number of hyperelastic, non-linear, isotropic element configurations. Different material models were investigated for their accuracy in replicating the material behavior of rubber over large deformations up to 300%. Two constitutive laws were found that closely predict the stress-strain behavior of rubber over large deformations: The Mooney-Rivlin Law [7] and the Ogden Law [8]. It is difficult to uniquely determine the material constants for these laws from experimental data. Special experimental machines are required that provide the unique properties for uniaxial extension, simple shear, equibiaxial extension, and pure shear.
The highly non-linear response of rubber [9] can be seen in Fig. 3. A mathematical method has been perfected that reasonably tracks the experimental data of Fig. 3 and the H-block pullout diagram of Fig, 4.
|
Fig. 3: Goodyear experimental measurements of rubber properties |
Fig. 4: 5-cable H-block arrangement |
5. H-Block Test and Splice Modelling
The H-block and splice models developed are fully parametric. All spice geometry details are variable from a single step splice through a four step splice, including the variables:
core rubber thickness
butt end clearance
step lengths
cable size and properties
lay sequence
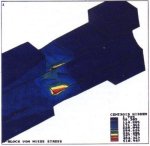
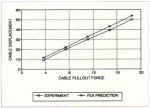
The H-block was analyzed for the 5 cable arrangement of Fig. 4. The peak FEM von Mises rubber stress is illustrated in Fig. 5. The peak stress occurs at the top and bottom covers where the belt has been notched and where the cable has been broken. From this analysis, the testing of cast-in-place H-block test samples is predicted to have quite different results from the cut-cable procedure. A pullout test measurement vs. FEM prediction is illustrated in Fig. 6. The Offset between theory and measurement may be a result of differing material properties or interpretation of the material properties from experimental measurements, The results are sufficiently close to provide confidence in the accuracy of the FEM approach. In Fig. 7, the associated maximum rubber stresses are plotted. In the elongation range shown of less than 100%, the pullout force versus displacement is close to linear, while the corresponding stress field is not.
|
Fig. 5: Cross-section H-Block von Mises stress gradient in rubber - expanded view |
Fig. 6: H-block pullout force vs. displacement - theory and measurement |
|
Fig. 7: H-block maximum rubber stress from Fig. 6 forces |
|
After investigating different boundary conditions, such as periodic, fixed sides, free sides, etc., the best results were obtained when three units of the operating pattern were used with partial edge restraint. In the post-processing phase only the central cable assemblies are then selected for stress-strain evaluation, The model is structured with one belt end clamped, while a fixed displacement is applied to the opposing belt end, Small load steps are required to allow for the model to follow the non-linear behavior of the rubber and cable response.
6. Modelling Results
6.1 Butt End Gap Dimensions
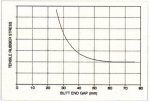
The butt end gap s is the clearance between cables from opposing ends that are butted on the same axis in the splice, as shown in Fig. 8. Installation criteria vary from 5 mm to 25 mm. When the cable ends are in close proximity, a higher rubber tensile stress influences the von Mises limiting stress criterion. The high tensile stress influence reaches a minimum threshold, when the butt end clearance is greater than 50mm, as illustrated in fig. 9. The illustration is for a specific cable diameter, Large cables require a greater clearance between butt ends than small cables. This example is for pure tension (i.e. no bending across the pulley face). The CDI minimal criteria for cable and butt end clearance is:
s=4()5mm (1)
where denotes the cord diameter.
|
Fig. 8: Two step splice schematic |
Fig. 9: Effect of butt end clearance on rubber stress |
6.2 Bend Zone Dimension
The splice bend zone, LB, shown in Fig. 8, is where cables are joggled to permit the passing of opposing cables. The bending of the cables causes additional stresses in the rubber shear zones. in the splice and in the cables at the bend. The model results predict a von Mises rubber stress change due to the torsional and bending response from joggling the cables. This effect is illustrated in Fig. 10. In a 213- splice, with an 11.9 mm diameter cable, the von Mises stress is reduced by about 10%, when the bend zone is lengthened from 200 mm to 300 mm, Many splice patterns have a bend zone length of 100 mm or less. DIN 22131 shows a 150mm bend zone. The degree of bending, or amount of axial offset, the splice pattern schematic, cable flexibility, core rubber dimensions in the belt and in the splice, etc. all contribute to the critical von Mises stress limit. The bend zone length may or may not significantly effect the threshold stress, depending on how these factors interact (e.g., the cable offset varies with the number of steps, cable pitch in splice, and schematic chosen). Existing standards, such as DIN 22131, and common practices recommend the cable butt end, from the opposing sides, to intrude into the bend zone. Our analysis shows a marked rubber stress riser at the cable tips. This suggests a point of failure, it is well known that the maximum rubber stress occurs at the cable ends of a well constructed splice, due to rubber shear, cable elongation, and tensile loading. We recommend the butt ends be terminated short of the bend zone the distance a In Eq. (1). The CDI minimum criteria for the bend zone length is:
LB = 15 () + 50mm. (2)
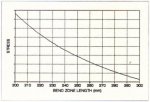
Fig. 10: Effect of cable bend zone on rubber stress
6.3 Splice Step Length
Increases in splice step length, LST in Fig. 8, reach a point of diminishing return as illustrated in Fig. 11. This effect will vary with core gum dimension, cable size, cable structural properties and splice schematic. Aging, impact degradation, and shock wave intensity from starting and stopping must also be factored into the selection of the appropriate step pattern and length.
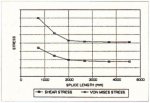
Fig. 11: Splice step dimension vs. stress
A two step or higher splice sequence, as shown in Fig. 8, will have certain cables with lesser lengths of rubber shear zones connected to opposing cables. Gables with smaller rubber connections will produce greater rubber deformation and lower resistance to the cable pull. This will produce higher local rubber stress and lower force for the respective cable. Therefore, the total amount of rubber in shear is not the only criterion for selection of the best schematic. Likewise, most higher step splice schematics will produce greater loads on one cable of the repeating pattern with a net reduction in their dynamic efficiency.
The peak cable stress is normally found on the member with the greatest amount of rubber connected in shear, The best splice, is one with the lowest cable and rubber stress. An increase in splice length alone may not provide any improvement in performance.
6.4 Steel Cable
The steel cable stress, as calculated by the FEM model, varies in the splice from the belts mean cable force, from a high of 135% down to 110% for the standard splice patterns studied. The cable's elastic modulus and bending stiffness can change the stress distribution arid magnitude for the same splice schematic. Cable stress is highly dependent on the core rubber thickness when the splice step sequence is greater than one. As the core rubber gap gets smaller, the rubber shear stress increases but the deformation decreases, resulting in a pseudo-welding of the cables into a more uniform deformation and shared tensile force.
A more elastic steel cord will increase the rubber shear stress due to its greater elongation in the shear zone between opposing cables The recent practice of increasing the rubber penetration into the interior of the cable increases the cable's elastic modulus [10] and reduces the rubber stress. This difference can be significant (20-30%) depending on the splice design, cable selection, and amount of rubber penetration.
6.5 Care Rubber Gap Dimension
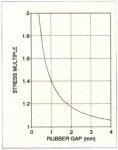
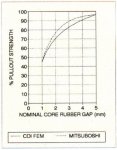
The core rubber shear and tensile stresses are highly dependent on the amount of rubber clearance g between opposing cables. Fig. 12 illustrates the shear stress dependence on the core gap clearance. This concept closely mimics the performance of published pullout tests [11] shown for comparison with the FEM work in Fig. 13. Fig. 12 provides some understanding of the cable lay tolerances required during splice manufacturing. Selection of the cable diameter and cable pitch Is closely associated with the possible choices of splice schematic and the resulting splice dynamic temporal strength. This choice must include the errors or tolerances of construction. Therefore, splices with rubber core gaps at or below 2 mm will likely suffer from greater stress risers and lower splice performance in excess of the nominal prediction. As an example, a 3 mm gap. with a 0.5 mm margin of error on installation, will show a rubber shear stress increase of about 5%. As the gap diminishes to, say, 2 mm, with a 0.5 mm gap error on installation, the rubber shear stress is estimated to increase by about 12%. The CDI minimum criterion for the core rubber gap is:
g=0.10()1.5mm. (3)
|
Fig. 12: Core rubber stress multiple vs. gap dimension |
Fig. 13: Pullout strength vs. core rubber gap-measurement and theory |
6.6 Dynamic Shack Wave Influence
The shock wave influence on splice design is, at present, not well understood. Very high strain rate effects are generated during stopping of high powered and high modulus belts when full power is disconnected. The stress front is traveling through the splice at about one meter per millisecond. It is known that an effect called "shear thickening/thinning" occurs in filled polymers (rubber mixed with carbon black). Shear thickening/thinning is where the material viscosity increases/decreases with the higher rubber loading frequencies as illustrated in Fig. 14. This means that greater or lesser shear forces are allowed when the higher strain rate increases or decreases the viscosity. As the belt ratings and cable strength increase, the elastic modulus and exciting frequency increase.
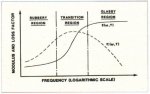
Fig. 14: Shear thickening/thinning viscosity h vs. strain rate (frequency)
6.7 Rubber Fatigue
Simo and Taylor [12] tested a constitutive model for rubber fatigue based on generalized viscoelastic rheological properties of rubber, This is an area where much more research is needed. Accurate assessments and influences of all rubber stress mechanics are not known today in conveyor belting or within the tire industry.
6.8 Splice Efficiency
Splice efficiency can be divided into four or more categories:
- Static or pullout test efficiency
- Dynamic - endurance or fatigue efficiency as tested under fluctuating forces.
- Schematic- ranking of step configurations
- Dimensional - tolerance Influence
A proper discussion of this topic needs to be addressed, but is outside the scope of this paper. One comment is allowed, We often hear discussions of splice efficiencies of 90-100% or over 100%. This cannot happen. The rubber and steel cords have localized stresses which exceed the nominal stresses in the belt, as noted in section 6.3 . This will be the focus for the point of failure. DIN 22101 suggests a best splice fatigue efficiency of 36%. At low step numbers (1 and 2) with near ideal conditions, the endurance level can reach above 80%. An example if the Channar 20 km overland in Australia. The St 3000 N/mm belt tested on the Hannover splice fatigue machine at 58% efficiency for 160,000 revolutions. The belt has a two step conventional splice with fabric reinforcing. The belt and splice pattern were supplied by ContiTech, Germany. Nordell was a design consultant on the Channar project, and assisted in its successful commissioning in 1989. The belt was designed with a service factor of SF = 5.0:1.
The Palabora, RSA, St 6600 N/mm belt was also tested at Hannover University for its four step splice dynamic efficiency. The four step (1342-) pattern reached a dynamic efficiency of 50% for 180,000 revolutions.
The belt and splice pattern were supplied by ContiTech, Germany. Continental supplied a fabric reinforcement in the splice design. Nordell was the design consultant to Fluor. RSA, on Palabora. and assisted in its successful commissioning in 1988. The belt has operated at close to a service factor of SF = 6.0:1.
Prosper Haniel, Germany. has a belt rating of St 7500 N/mm, with a similar four step (1342-) splice pattern. This belt reached a 38% efficiency on the Hannover machine after 180,000 revolutions. The lower rating may be due to core rubber compounding for high flame retardant properties.
No matter how long the splice is made, it must eventually terminate into parent belt ends. At this junction, the cables will not have equal load, for many reasons. Therefore, some cables will be subjected to forces in the transition region (within the splice and beyond) that exceed the nominal cable loads. Also, the parent belt forces are mainly carried in the cables, not the rubber. In the splice, the rubber carries all cable forces. As noted in this paper, the rubber stresses can and probably do have weak points which reduce the splice structural capacity and therefore its efficiency.
7. Additional Considerations
Finite element modeling of the splice may provide understanding of many additional attributes which ultimately limit splice performance, such as:
fabric reinforcing techniques
pulley curvature influence on rubber and cable fatigue stress
pulley surface irregularities and their influence on rubber and cable fatigue stress
belt and splice surface irregularities on cable fatigue
cable fatigue stress limit due to the wire rope sizes, helix angle; lay arrangement
proximity of two or more splices and their interaction
cover rubber gauge influence and cable alignment
pulley cover rubber radial shearing by belt's steel cords due to bending around pulley (pulling in of cords towards pulley axis; pulling out of cord butt ends at splice joints away from pulley axis)
pulley cover tangential shear due to high motor torque and/or high contact friction
rubber compound dependent fatigue stress limits for normal rubbers and flame retardant rubbers
construction tolerances of parent belt and splice
effects of broken cable locations and methods of repair
manufacturers compatibility of splicing compounds and core rubbers
optimal splice step schematic
mismatch of belt cables and belt thicknesses.
Belt surface irregularities can have a profound effect on splice strength as the belts elastic modulus (tensile rating) and speed increase. Splice lay up defects, mismatched belt thicknesses, mismatched cable diameters, mismatched covers, and excessive press lap gaps during manufacturing can cause high momentary impact loads on the belt when it enters a high tension pulley (Fig. 15).

Fig. 15: Steel cord fatigue stress riser owing to surface irregularities
The installation orientation of the press lap may be critical to good belt performance. The press lap raised edge should be installed to fall on the high tension pulleys. To a lesser extent, the idlers can also produce an impact force, especially along the convex curves at the high tension zone. When these forces become significant, fatigue damage may result to the steel wired in the rope leading to a ductile failure.
8. Conclusions
Greater strength, reliability and economy are still the targets of our trade. This review presents the approach of Conveyor Dynamics, Inc. in our investigation of steel cord splice performance using finite element methods (FEM).
FEM provides the tools to inspect the many interactions of cable design, rubber properties, dimensional sensitivities, manufacturing methods, and installation imperfections.
Increases up to a limit in the butt end gap were found to reduce the tensile stresses in the rubber in the gap. The increase in length of the bend zone which effectively reduced the angle through which the cables had to bend also had a favorable effect on the shear stresses in the rubber, An increase in splice length initially reduced rubber shear stresses, but after a certain length no additional gain is achieved.
These results have been utilized by Conveyor Dynamics, Inc. to develop proprietary splice configurations whose geometries have been optimized in order to lower the operating stress levels in both rubber and cables.
It is our hope that this and associated methods will set a new standard of performance and assurance in belt conveyor technology.
Acknowledgements
We are grateful to Fluor Daniel Inc. for their generous support of our research, and commitment to advancing this technology, and to Prof. Dr.-lng. Manfred Hager, Hannover University, Germany, for his cooperation and advice in our laboratory testing program.
Also, we appreciate the cooperation of The Goodyear Tire & Rubber Company for their candid release of research data, and to ContiTech Frder- und Beschichtungstechnik GmbH, Hannover, Germany for their laboratory testing work.
References
- Flebbe, H.: Dynamic Joint Strength as a Criterion for Conveyor Belt Design; Glckauf + Translation 124, No.6, 1988.
- Desalvo, G.J and Gorman, R.W.: ANSYS 4.4; Swanson Development. Houston. Pennsylvania, USA.
- Hager, M. Chances for Development in Belt Conveyor Technology in Open Pit Mines; bulk solids handling, Vol. 11(1991) No. 1, pp. 157-167.
- Lorani A.: Steel Cord Conveyor Belts; Paper presented at the Conference of the German Rubber Association, Freiberg, October 1962.
- Anon.: Palabora In-Pit Crusher and Conveyor; E&MJ, April 1990.
- Costello, G.A.: Theory of Wire Rope; Springer Verlag, 1990.
- Rivlin, R.S.: Forty Years of Nonlinear Continuum Mechanics; Procs. of the Ninth International Conference on Rheology, pp.1-29, Mexico, 1984.
- Ogden, R.W.: Large deformation isotropic elasticity: On the con-elation of theory and experiment for compressible rubberlike solids; Procs. Royal Society London, A. 328, 567-583, 1972.
- Courtesy of Goodyear Tire & Rubber Company: Test results from equibiaxial testing apparatus.
- Wolf, G.H. and Singenstroth, F.: The Influence of Rubber Penetration on the Dynamic Elasticity Modulus of a Steel Cord; Kautschuk + Gummi, Vol. 37. October 1984.
- Simo, J.C. and Taylor, R.L.: A Three Dimensional Finite Deformation Viscoelastic Model Accounting for Damage Effects; Dept. of Civil Engineering, Univ. of Califomia, Berkeley, USA, Report No, UCB/SESM-85/O2, 1985.
- Kakuda, M.: Performance Required for Steel Cord Conveyor Belt Core Rubber; bulk solids handling, Vol. 3 (1983) No. 3. pp. 463-467.
Lawrence K. Nordell, President; Dr. X. Qiu, Director of Applied Mechanics; V. Sethi, Research Engineer; Conveyor Dynamics Inc. (CDI), 1111 West Holly Street, Bellingham, WA 98225, USA
![]()