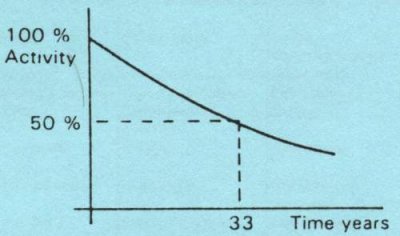
Figure 1. Half-life of Caesium 127.
| Process Automation Technical Data |
|
Application. Dilution of overdense stock density to correct (target) density delivered to the separation device (cyclone, drum etc). The correct medium is measured via a Process Automation gamma density gauge after the pump that feeds the separation device.
Density Gauge Installation. Install the density gauge on a vertical pipe after the pump, approximately 4 metres above the pump. The pipe must be straight and contain no entrained air bubbles. Also follow the general rules for the installation of density gauges per Process Automation technical data (copies available on request). Ensure that representative density samples can be taken for calibration purposes.
Make-up Water Supply. The make-up water to be clean and supplied via a steady head tank or a pressure controlled supply (constant pressure). A varying water supply pressure causes corresponding changes in the water flow rate through the control valve that can confuse the density controller. Gritty water accelerates wear of the control valve seat. The control valve to be correctly sized and fed by a line of at least one size larger than the diameter of the valve (or more, depending on the line length). A solenoid valve may be required in the water line so as to cut off the water flow when the plant is stopped.
Stocktank Medium. The density of the medium in the stock tank to be manually controlled (rough primary control) so that a minimum of make-up water is required to dilute the over dense medium to the target density.
Valve Sizing. Control valves should operate in the 20 to 40% open position, under normal operation, to ensure sufficient rangeability. The valve should be positioned at a height higher than the stock tank level to ensure that stock medium does not back up into the valve on plant stoppage. The water should be delivered from the valve into the pump via a quick coupling flexible hose to the pump inlet. A valve position indicator is of great value in monitoring the primary control devices. I.e. ensure that the overdense medium is at the correct density.
Controllability. Automatic density control makes a good plant better and a bad plant worse. For good control a plant must be stable and predictable. The control system can only correct a slow drift away from the required density by increasing or decreasing the amount of water injected at the pump inlet. Before switching to auto control, first ensure that the plant displays short-term stability and responds appropriately to an increase or decrease in dilution water flow rate.
NON-CONTACT NUCLEAR GAUGES Presented at a regular meeting of the SA Institute of Measurement and Control
Whilst there are many ways of determining the level or density of a process, most of the devices rely on the necessity of process contact: probes, diaphragms, process window or sound cone transmitters, etc. The nuclear radiation gauge therefore stands out as being a truly non-contact device, for corrosive and problematic applications.
Although these devices involve a slightly higher capital cost, they have nonetheless proven extremely cost efficient. The main reasons are: extremely long life expectancy; simple and quick maintenance; solid-state sensing and actuation of process; and the fact that the plant process need not be interrupted due to instrument removals, service or calibration and, thus, plant downtime is rarely attributed to instrument maintenance.
Types of radiation
Whether considering natural or manmade radioactive isotopes, there are three main types of radiation energy transmitted from an isotope during its natural process of decay:
Alpha
Particle emission consisting of two protons and two neutrons (as found in the helium nucleus).Beta
Electron emission only.Gamma
This radioactive emission is similar to that of radio and light waves in that it is basically electromagnetic in form, although of a different magnitude of frequency. This electromagnetic radiation also exhibits particle acceleration characteristics; the particles being commonly termed photons.Although both beta and gamma radiation emitters are extensively used as isotopes when determining the thickness of plastics, metal and paper, in level and density applications, gamma radiation emitters are used almost exclusively due to their ability to penetrate (energy level) the type of pipes and process vessels most commonly encountered in the process industries.
Table 1. Energy level and half-life of several radioactive sources
Isotope
Energy
Half-life (years)
Americium (Am 241)
66
455
Caesium (Cs 137)
660
33
Cobalt (Co 60)
1250
5,5
Radium (Ra 226)
1500
1620
Gamma ray emitters
The energy levels in Table I relate to the energy of each particle (photon) expressed in electron volts emitted from the isotope. Its half-life, displayed in years, indicates the period of time necessary for the isotopes emission strength to decay to half. Thus for a Caesium 137 source isotope of 100 unit strength the energy level of the emitter would decay to 50 units in 33 years. It can be seen, therefore, that of all the commonly used gamma emitters, the Caesium 137 isotope is the most practical emitter for industrial application due to its relatively high energy level and half life expectancy even with the initial cost of the isotope taken into account.Isotope activity
The strength or activity of an isotope is simply the number of particles (photon disintegrations) given off over a unit period of time.The unit of activity is the Curie (Ci) with the more practical mCi defined as:
1mCi = 3,70 x 10⁷ disintegrations/s
It should be noted that this definition does not consider the inherent energy of the emitted particle.
For practical purposes the range of isotope strength can be limited from 5 mCi through to 10 000 mCi. Since the emissivity / level of any one isotope is not affected by temperature, it can be considered as a very stable and predictable energy source for gauging applications.
Source decay
As an isotope decays its energy level reduces in an exponential manner: defined as the time a stated source activity decays to one half its original activity (Figure 1).

The activity decay, in any application, manifests itself as a zero drift. For exam-plc, during the first year of operation the decay of a caesium source is approximately 2% and, in the case of level applications, can be practically ignored. However, when applying the gauge to a narrow span density application in the range, for example, of 1,1 to 1,2 SG units (a small amount of solids between source and detector in solution), it can be clearly seen that a shift of 2% in isotope activity could result in considerable zero-setting drift over a period of, say, 30 days.
The zero drift due to source decay can be approximated by:
N = P x S
Where:
P = pipe diameter (mm)
S = density span
N = number of days of source decay to cause a zero shift of 1% of span.In such cases, it would be necessary to determine the acceptable percentage error in days drift and reset the gauge every prescribed period. However, if this is not possible or practical, a source decay compensation device can be fitted to automatically adjust the zeroing function. In this way, source activity decay can be accommodated up to three years without resetting.
Radiation dose
This is defined as the measure of radiation absorbed in a unit volume of material at a prescribed distance, and is commonly expressed in rntgens (R) or coulombs/kg (C/kg).These units are based on ions created per kilogram of air with: 1 C/kg = 3876 R.
For practical use the diminutive unit (mR) is still a standard unit when appreciating isotope emissions.
Safety
The internationally accepted limits define the maximum radiation dose acceptable to any man as 100 mR per week. This means, effectively, that a person can work for 40 h per week at an exposure rate of 2,5 mR/h. Most portable dosage meters are calibrated in mR/h with multiplication of the mR/h, by the total exposure time, yielding the total radiation dose absorbed in any given period of time.To simplify standard units, a measure of radiation in terms of man has been established which helps to clarify just how safe these devices are in biological terms. This unit is defined as the REM (rntgen equivalent man) or the dose time biological effect factor.
To give a practical comparison of the normal radiation levels experienced while working with the latest nuclear gauging instruments, in a normal density gauge or level installation the radiation level at approximately 300 mm from the isotope container will be in the region of, 5 mREM/h. For gamma rays, the biological factor is unity and thus mR = mREM. Bearing in mind the universal laid down limits of 100 mR in one week (the equivalent of 100 mREM) consider the radiation levels shown in Table 2 which are experienced in everyday life.
Environment |
mREM |
Natural background in Johannesburg (building, cosmic, and mineral) |
250 |
Chest X-ray |
40 |
Random badly ventilated home |
300 |
Potassium 40 (found in ones own blood) |
20 |
Radiation found on boundary of nuclear power plant |
5 |
Average within 70km |
0,01 |
In a survey conducted in the USA and published in Scientific American February 1982, the misconceptions illustrated in Table 3 were evident.
It is interesting to note that the annual deaths registered due to nuclear radiation include the unfortunate individuals that were involved in the late forties during the very early nuclear bomb-testing program. These of course were primitive times in regard to virtually unknown hazards.
Observed risks |
Actual deaths per year |
Perceived risks |
|||
Ranking |
Risk |
League of women voters |
College students |
Businessmen and professionals |
|
1 |
Smoking |
150000 |
Nuclear power |
Nuclear power |
Handguns |
2 |
Alcoholic beverages |
100000 |
Motor vehicles |
Handguns |
Motorcycles |
3 |
Motor vehicles |
50000 |
Handguns |
Smoking |
Motor vehicles |
4 |
Handguns |
17000 |
Smoking |
Pesticides |
Smoking |
5 |
Electric power |
14000 |
Motorcycles |
Motor vehicles |
Alcoholic beverages |
6 |
Motorcycles |
3000 |
Alcoholic beverages |
Motorcycles |
Fire fighting |
7 |
Swimming |
3000 |
General aviation |
Alcoholic beverages |
Police work |
8 |
Surgery |
2800 |
Police work |
Police work |
Nuclear power |
9 |
X-rays |
2300 |
Pesticides |
Contraceptives |
General aviation |
10 |
Railroads |
1950 |
Surgery |
Fire fighting |
Hunting |
11 |
General aviation |
1300 |
Fire fighting |
Surgery |
General aviation |
12 |
Large construction |
1000 |
Large construction |
Food preservatives |
Mountain climbing |
13 |
Bicycles |
1000 |
Hunting |
Spray cans |
Large construction |
14 |
Hunting |
800 |
Spray cans |
Large construction |
Bicycles |
15 |
Home appliances |
200 |
Mountain climbing |
General aviation |
Pesticides |
16 |
Fire fighting |
195 |
Bicycles |
Commercial aviation |
Skiing |
17 |
Police work |
160 |
Commercial aviation |
X-rays |
Swimming |
18 |
Contraceptives |
150 |
Electric power |
Hunting |
Commercial aviation |
19 |
Commercial aviation |
130 |
Swimming |
Electric power |
Electric power |
20 |
Nuclear power |
100 |
Contraceptives |
Food colouring |
Railroads |
21 |
Mountain climbing |
30 |
Skiing |
Prescribed antibiotics |
Scholastic football |
22 |
Power mowers |
24 |
X-rays |
Mountain climbing |
Contraceptives |
23 |
Scholastic football |
23 |
Scholastic football |
Railroads |
Spray cans |
24 |
Skiing |
18 |
Railroads |
Bicycles |
X-rays |
25 |
Vaccinations |
10 |
Food preservatives |
Skiing |
Power mowers |
Half value
A half value may be defined as that thickness of a given material that, when placed in the path of radiation, will reduce the incident radiation by 50 % or one-half. Thus, for example, the half value of steel with Caesium 137 is approximately 15 mm. Therefore from Figure 2 it can be seen that 30 mm of steel (the walls of a pressure vessel being 15 mm in thickness each side) will reduce the power of a 20 mCi isotope to 5 mCi (or by 75 %) according to the formulae:From Table 4 it can be seen that the half value is inversely proportional to the density. For materials with a density less than 8,0, it is possible to approximate the half value by dividing the half value of water (100 mm) by the density of the material in question.
HV = 100mm / Density
Since it is desirable in some applications to maintain a constant radiation level at the detector, adding or deleting one half value of material between isotope and detector will require the increase or decrease of source size selected by a factor of 2.
Detectors
There are three main types of radiation detector devices in use today, the photomultiplier / scintillator counter, the Geiger Muller tube and the ionisation chamber.
Figure 2. Half value is the thickness of material that decreases the radiation by half.
Material |
Density (gm/cm) |
Half value (mm) |
Bulk material |
0,50 |
200 |
Water (H2O) |
1,00 |
100 |
Refractory (A12O3) |
2,25 |
45 |
Aluminium (Al) |
2,70 |
38 |
Steel (Fe) |
7,86 |
15 |
Copper (Cu) |
8,96 |
12 |
Lead (Pb) |
11,40 |
7 |
Table 4. Density and half values of several materials
Photomultiplier type / scintillation counter
In this device (Figure 3) operation depends upon incidental radiation (gamma photons) striking a crystal (normally Sodium Iodide (Na12)) producing scmtillations of light.
The photons of light, in turn, strike the photocathode of a photomultiplier tube producing photoelectrons that are, by their nature, attracted to the positively charged dynodes producing more electrons by the phenomena of secondary emission.
This process produces a current that is a function of the intensity of the incident radiation.
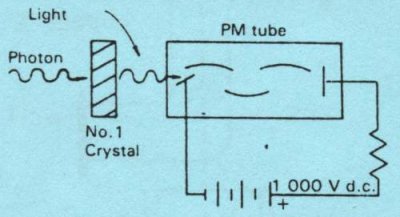
Although this device has the capability of very high amplification and sensitivity it has the disadvantage of requiring an extremely stable and regulated power supply and is very sensitive to temperature variations. In fact temperatures in excess of 50C, at the detector, will have a permanent degrading effect on the photocathode employed. Another disadvantage is its inability to withstand vibration or sudden shock. In short, this device is extremely suitable for laboratory conditions where very sensitive measurement systems are required.
Ionisation chamber
This type of radiation detector (Figure 4) requires a relatively large diameter steel chamber and centre electrode and its operation depends on the collision between gamma photons and a heavy inert gas molecule. To this end the chamber is filled with a gas, such as argon, at approximately 400-500 kPa. Using high pressures and heavy gas molecules enhances the collision factor and increases the systems sensitivity and response times.The major advantage of this system is that the resultant current (pA) is continuous and proportional to the intensity of incident radiation. Further, its construction affords a considerable amount of ruggedness and high reliability; it operates at a low excitation voltage of approximately 14 V D.C.; and it is independent of power supply fluctuations. When stable it is not a temperature sensitive device and can withstand operation temperatures of 150C without permanent damage.
Geiger Muller tube
The Geiger Muller tube (Figure 5) consists of a small diameter metal tube (15-20 mm) filled with a heavy inert gas, such as argon, at a low pressure of approximately 14 kPa. It has a very thin centre electrode wire that creates a high electrical potential stress so that when any nuclear particle produces a single ion pair within the heavy gas medium, an avalanche effect of electrons is created resulting in a pulse of current which can either be averaged or counted.Its advantages are its relatively small size and cost. However, due to the nature of operation, the larger the incidental radiation, the faster the unit will develop current pulses. Although this enhances its sensitivity and resolution, when used as a nuclear switching device, its normal finite life is 1012 pulses - a life expectancy of seven to eight years. Consequently, when subjected to radiation levels of more than approximately 2,5 mR/h activity, the tube life will be greatly reduced. It is also not an effective device when subjected to temperatures in excess of 75C.
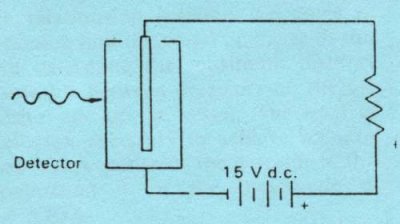
Figure 4. Operating principle of ionisation chamber.
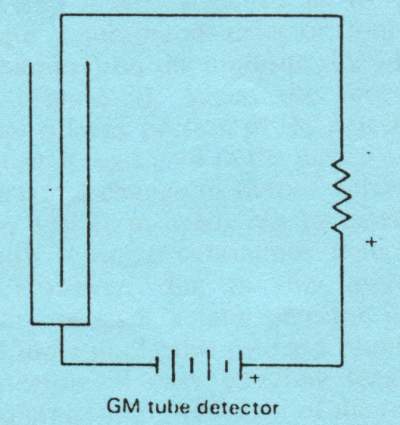
Figure 5. The Geiger Muller tube operation.
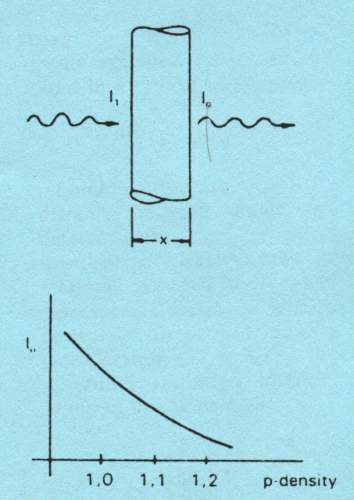
Figure 6. Principle of density gauging.
Density gauges
It is possible to construct a typical density gauge where radiation is absorbed exponentially according to the formula:Io = Iie-upx
Where:
Ii - radiation intensity into the process
Io radiation intensity out of the process
u - mass absorption coefficient
p - density of process material
x - path length through measured materialThe mass absorption coefficient is a characteristic of the process material measured and can be considered a constant when the material has an atomic number less than 30. Since the distance X is also a constant, the only variable left is the density of the product, with the resulting radiation 1~ a direct function of the process density (Figure 6).
Simple guidelines must include:
- The gauge should always, if possible, be mounted on a vertical section of pipe with the process flow in an upwards direction to ensure a full pipe section and little or no settling out of suspended solids between detector and source;
- If a gauge has to be mounted on a horizontal pipe section then the source and detector set must be mounted in the horizontal plane, again to minimise the effects of settling out of suspended solids;
- For SG ranges of 1,0 and above it is practical to install a bypass pipe, with isolators, valves and sample pipe sections, to facilitate simple calibration and sample testing using water, without interruption of the process flow;
- In most applications the presence of entrapped air bubbles in the process fluid has a detrimental effect on the system since it is volume/density sensitive and any air passing between the source and detector will allow more radiation to pass between them;
- Where the process has a tendency to adhere to the inside surface of the pipe the deterioration of the density gauges performance would manifest itself as a zero error. If this build up is relatively small, or in fact reaches equilibrium, it can be adjusted out of the density span and taken into account on re-calibration as for the process pipe walls.
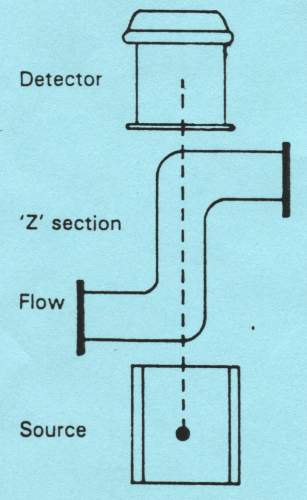
Figure 7. A Z-axis installation Increases resolution without the necessity for decreasing the source size.
- When applying nuclear density gauges to very narrow density spans (0,03 to 0,1 gm/cm3) it is very important to take into account the decay of the gamma isotope and product temperature compensation as both these variables, although considered negligible on large SG spans can, in fact, contribute to drift conditions in excess of the desired span in an alarmingly short time. These conditions can be overcome using automatic temperature and source decay compensation devices built into the density gauge; and
- For any practical density gauging system to function correctly it is imperative that the process density, combined with the type and size of the source selected, enables a sufficient change in radiation absorption to facilitate sensitivity, repeatability and most important resolution. Therefore, on some applications, should the SG span and the cross section of pipe is relatively small, it will be found that the volume may not he sufficient to cause any appreciable change in radiation absorption. It does not help, in this instance, to lower the size of the source since it is normally found that this measure approaches the normal background radiation level (cosmic and material/plant radiation) and thus the time-constant increases to such an extent as to invalidate the use of these devices altogether.
A practical solution to this problem is a Z axis installation as shown in Figure 7. This effectively enlarges the cross-section of the pipe and results in greater suspended particle mass. In this manner a source, well in excess of normal background interference, may be used which increases accuracy, response and resolution to an acceptable level.
Level gauges
There are two types of nuclear level gauges - the simple level switch (on/off device) and the continuous level gauge.Single point level gauging
A standard system comprises one or more Geiger Muller tube detectors placed on the outside of a holding vessel with a single gamma ray emitting isotope mounted on the opposite side (Figure 8). The source is sized so as to facilitate total radiation black out when the process material comes between source and detector.Using a collimated angle source, where lead collimating plates are adjusted to produce a beam of radiation at an angle of 450, a dual system can be accomplished providing Hi and Lo level points on any holding tank or vessel. The only precaution to be considered is the relationship between the angle of radiation and the vessel diameter, as this will determine the maximum distance allowable between detectors on the opposite side of the vessel. The level of radiation necessary to achieve accurate and fast response of the detector in this application is of the magnitude of 2.5 mR/h.
Continuous level
The source in this instance is collimated to develop a 45 angle so as to illuminate a continuous detector (ionisation chamber) on the opposite side of a vessel (Figure 9). When the process shades off any portion of the detector the effect is registered in the device as a proportional change in output current. In this way 16 m heads can be catered for with a single continuous detector unit. However, due to the impracticability of such a long detector it is found more applicable to use a number of detectors in easy handling lengths overlapping the entire height of the tank or vessel.
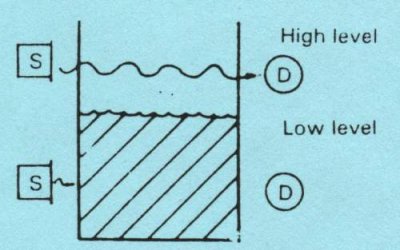
Figure 8. Single point level gauging.
Source sizing
The following equation relates all the factors found in a typical level application:mC = K (d2)(2HVT)(mr/h)
Where:
mC = required source size
d = distance between source and detector (in)
HV1 = number of half-values of material between source and detector
K = constant of proportionality (for Caesium 137 = 3,2)
mr/h = minimum radiation intensity required by the detector
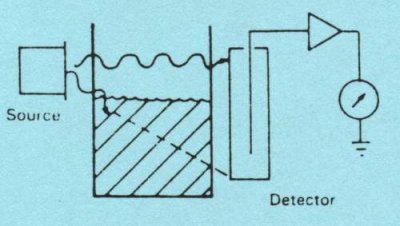
Figure 9. Continuous level gauging.
To accurately calculate the source size (the main problem in level gauging) it is thus necessary to know the following:
Source to detector distance (D)
As with light, gamma radiation intensity decreases with distance and, therefore, when approaching any level application the longest path of radiation source to detector must be considered. This of course will be determined by the vessel diameter.Half values in materials present
All materials between the source and detector i.e. steel walls, lagging, refractory lining, bricks, internal structures and agitators, etc. must all he calculated into their relative half value units, to produce a maximum total. The process material does not normally have to he considered as long as there are more than two half values between source and detector (i.e. inside diameter of the vessel is 2 x Hv of process material).Build-up
This type of build-up on the walls of any vessel can produce an effective zero drift in this type of device and should be avoided.GENERAL NOTES ON DENSITY SENSOR INSTALLATION
- Slurry lines usually have a characteristic flow profile, depending on factors such as particle size, viscosity etc. The flow rate may change the profile, depending on interferences, bends and the condition of the pipe.
- Because of this flow profile, the density sensor must be installed on a vertical pipe. A, guideline is to situate the density sensor about ten pipe diameters above the last interference point such as valves, bends, junctions etc. The sensor should also be no closer than six pipe diameters to any interference point after the sensor.
- The pipe must always be full and contain no air bubbles.
- Do not install at a point of rapid pipe wear, such as at a pump discharge.
- Consider the practical needs for sampling and/or pipe empty or fill of water for standardisation/calibration purposes. Avoid the high-pressure section of the pipe, especially for sampling points.
- Use HDPE or thin walled (Schedule 40) steel pipes to minimise isotope activity wherever possible.
- Install at least three meters away from where personnel are permanently stationed.
- Support the pipes for safety since the sensors can be heavy. HDPE pipes usually require support.
- Vibration is destructive. Ensure that vibration is minimised at the point of installation. If necessary mount the sensors around the pipe without contact to the vibrating pipeline.
- Avoid installation points where process or water spillage occurs. Also avoid areas of high temperature direct sunlight or rain.
- Ensure ease of access for maintenance
- Provide supports for electrical cables to prevent damage caused by people front standing or hanging on these cables. Also provide sufficient slack in the cable to ensure a measure of flexibility.
Industry: Mining/Mineral recovery.
Process: Water recovery.
Problem: To save water, tailings are pumped at the maximum safe density to shines dams. If the slurry density is too low, excess water is deposited on the slimes dam. If the slurry density becomes too high, it becomes difficult to pump.
Solution to the problem: The pump speed of the thickener underflow is controlled by the UNIPRO controller to maintain the optimum underflow slurry / sludge density.
Equipment Used: Process Automation manufactures a range of density and mass flow density gauges to measure and control process densities. Mass flow gauges will additionally indicate and totalise the dry solids carried in the slurry.
HEAVY MEDIA SEPARATION PLANTS
Industry: Coal and Diamond mining. Mining general.
Process: Beneficiation and concentration of product. Sorting, by the use of an artificial medium of appropriate density.
Problem: The density of the correct medium determines the sp1it of the product into heavier and lighter components. This density has to be accurately controlled to ensure The proper split of the podduct.
Solution: Dilution water is added to the overdense medium to dilute it to the required value. The water flow is controlled via a modulated valve. Some processes also require that the overdense density be controlled.
Equipment Used: Process Automation manufacturers a range of density measurement and, control systems. The UNIPRO controller will accept or remote set point control signal and provides an output to a control valve or splitter box. Recorder and valve position indicator may be added to the system
DRY MASS FLOW MEASUREMENT OF SLURRIES IN PIPES
The measurement of the flow rate of a slurry in a pipe line, and the measurement of the slurry density by gamma density gauge, are well known techniques. The weight of the carrier liquid, almost invariably water at specific gravity near one, is electronically subtracted and the dry mass flow is computed and totalised to make what is known as the "Mass Flow Meter".
While the technique is well developed, it is nevertheless important to the prospective user to know the installation and application requirements for making a successful installation. If forewarned, the prospective user can take the necessary steps to ensure that the installation will be workable and give the best results with a minimum of attention. If certain important requirements are overlooked, a Mass Flow Meter could well completely fail to perform to the required accuracy.
Historically, the two primary measuring devices are the gamma type density gauge and the magnetic flow meter. The density gauge provides the weight or mass signal and the flow meter the velocity signal to the mass flow multiplier, which computes the mass rate. The weight of water is deducted to provide a dry tons flow indication. It is possible, if required, to extract the tons water or slurry flow instead of the dry pulp flow signal. At all times the density signal and the flow rate signal is available for density or flow control purposes, but it should be specified on ordering.
The mass flow signal may be further processed in the optional totaliser driver to provide tonnage totalisation on an electro-mechanical or electronic counter.
The functioning of the complete system is naturally dependent on the correct and accurate performance of the density gauge and the flow meter, which are application sensitive devices. In recent times the magnetic flow meter has been successfully substituted by the Doppler flow meter in some applications.
REQUIREMENT FOR ACCURATE DENSITY MEASUREMENT: A gamma type density gauge works on the principle of the absorption of gamma rays by mass interposed between the radioactive source and detector. If the density of a slurry increases, fewer gamma's will reach the detector, thus indicating greater mass. The gamma's emitted from the source are usually collimated into a narrow beam passing through the centre of the pipe.
- Flow profiles will therefore affect the accuracy of a density gauge. For best results, fix the gauge heads to a vertical pipe in which is an upwards flow having a straight line, approach for approximately ten pipe diameters before entering the section where the density gauge is located.
- Absorption of gamma's is proportionate to the intervening mass. Density measurement is therefore only possible when the volume is constant. For this reason the pipe must be full at the point of measurement, and must be of rigid construction i.e. not elastic.
- Aeration (air bubbles) is really a condition similar to (2) above, but we treat it separately being a common fault which has serious detrimental affects on density measurement, and is not easily noticed. Air is sucked into the pump due to poor seals or cavitation. The process is also often aerated in the sump by the discharges into the sump which carries air downwards. Air carried into the process this way will escape back to the surface unless it reaches the suction of the pump first. Sump level control plus, well designed in-flows will cure this problem.. Note that microscopic air particles (entrained air) is not easily discernible and will result in density calibration errors.
- Pipe scaling is a very common bugbear in the gold mining industry. There is no easy solution to this problem. Sometimes increased velocity prevents build-up, sometimes reduced pressure i.e. placing the mass flow gauge near the discharge end of the line; There is no single answer to the problem since the scaling tendencies of slurries are different in different areas and different processes. In some instances scaling is unavoidable. The density gauge is affected by scaling two fold: -
- The pipe wall thickness is increased causing greater radiation absorption, and
- The effective pipe ID is reduced, thus decreasing the sensitivity (Span.) of the gauge. Periodic standardisation is a solution to the problem, but very serious scaling may require re-calibration or pipe cleaning.
- Pipe wear is often encountered where coarse slurries are pumped. The effect on the density gauge is opposite to that of scaling. Rubber lining, stainless steel or HDPE sections and regular replacement are the various cures for pipe wear. Periodic density gauge standardisation will keep the gauge within acceptable calibration limits.
- Particle size affects are encountered with coarse slurries, but is seldom problematic unless the particle becomes big enough to the point where it no longer necessarily travels at the liquid velocity. A complete change in particle size distribution may cause a small calibration shift. If the slurry consists of more than 20% of the total, of solids in excess of 2mm, it should be noted as a possible problem. Changes in the specific gravity of the solids will cause proportional errors.
- Calibration will determine the absolute accuracy of a density gauge. While the possibility of pre-calibration does exist, the user nevertheless wants proof of correct calibration. This leads us back to calibration of the density gauge against samples drawn from the process line. It must be fairly convenient to draw representative samples from the process line. Unless pre-calibrated, these samples must cover the entire working range, which necessitates changing. the process density and holding it steady for long enough to read the gauge and take a few samples Many interesting calibration methods have been developed and warrants a full discussion with the prospective user. It should be borne in mind that a mass flow system will never give correct readings unless the density gauge is accurately calibrated. What makes this point more significant is that density gauge errors are amplified through the mathematics used to the following formula:
Mass flow error = (Density Gauge Error x Pulp SG) / Pulp SG-l
The calibration of the density gauge therefore warrants the utmost consideration. Low SG applications should be avoided if possible since the mathematics of the formula greatly amplifies the density measurement errors.
Example: At S.G. of 1,05 a 2% density error results in a 42% mass flow computation error!
The problem is further compounded by the fact that the carrier is not water at SG 1,00 most of the time. Plant water re-circulates and the SG often varies around 1,03 to 1,06; once again multiplying the error. This may render applications, where the slurry SG is below 1,2 of no or little value to the user.
- The source will decay to half life in approximately 30 years, assuming caesium 137, which is the standard source used for density measurement. The decay causes a slow change in the calibration of the density gauge. Although modern microprocessor based gauges compensate for this decay; there are other slow changes also taking place elsewhere in the system, as well as pipe wear or scaling. Although minor, they nevertheless require restoration or "Standardisation back to the original calibration value. This is done by interposing a standard lead block between source and detector and setting the density gauge up to read the same as the original readings. During the standardisation procedure, the process pipe must be empty. The standardisation procedure is easy to perform and requires only a few minutes once the process pipe is assuredly empty.
The required frequency of standardisation is determined by the application conditions, varying from one to four times a year coupled with built-in source decay compensation. Clean water i.e. water at SG 1 in the pipe can also be used for standardisation and is strongly recommended being the most complete test.- Standardisation is not sufficient to ensure the maintenance of accuracy, being a one-point check. After standardisation the instrument span may still be wrong. To check the instrument span, it used to be standard practice to take samples from the process line. This is a risky method and very expensive in service costs. The most modem mass flow gauges now provide on-scale calibration blocks which give an adequate and dependable instrument span check, eliminating the operator dependence of hand sampling. Automatic span compensation is usually incorporated in modem density gauges and the calibration block serves mainly as a periodic check on this automatic function.
- There are large and small pipe size limitations as well as high and low slurry density SO limitations.
REQUIREMENTS FOR ACCURATE FLOW MEASUREMENT:
While there are many types of flow meters available today, only the magnetic flow meter and sometimes Doppler flow meters are suitable for the flow measurement of slurries because of there unobstructed through bore construction and non-intrusive nature.
THE MAGNETIC FLOW METER:
In principle it is an electric generator where the slurry (as Conductor) moves through a magnetic field, cutting the magnetic lines of force and thus developing a potential directly proportionate to velocity. This potential is picked up by electrodes and processed in the flow-to-current converter. The magnetic field is an alternating current, which is only accepted as the true signal if it is of the correct phase. The meter is lined with a suitable abrasive resistant liner.
- Just like the density gauge, the flow tube must be situated in an upwards flow having a straight line approach for approximately 3 to 4 pipe diameters before entering the flow tube. With modern flow tubes there may be no valid reason for this requirement except to prevent excessive wear due to turbulence. Many flow tubes have been damaged by neglecting to ensure that there is no change in internal diameter from the normal slurry line to the flow tube, thus causing torn liners or damaging eddy currents in the tube.
- Since the process has to carry an electric current, it must have a minimum conductivity. This is never a problem with mine slurries.
- Material build-up on the inside of the flow tube has a number of serious affects on the accuracy of the, flow meter. The flow meter is basically a velocity meter. If the scaling changes the internal diameter of the tube, the volume flow rate will be incorrectly indicated, even if the velocity is still correctly measured. A severe build-up may sufficiently insulate the electrodes to cause further errors. Sometimes the choice of the critical velocity will avoid scaling, but is incurable in some instances. Various methods are employed to remove scaling from the inside of flow tubes. Some flow tubes have mechanical scale breakers, removable or self-cleaning electrodes etc.
- Magnetic flow meters are pre-calibrated on clean water. The flow converter calibration can. be checked and may also be re-calibrated very easily. Accuracy's are usually in the order of plus minus 1%, and unlike the density gauge, it has a linear effect on the mass flow system i.e. a 1%flow error will cause a 1% mass flow error. On most slurry lines the flowmeter pre-calibration is not sufficiently accurate (errors in the region of 5% are often recorded). A drop (volumetric) test is necessary for acceptable calibration.
- Magnetic flow meters are adversely affected by the magnetic content of a slurry. Generally, a standard flow tube will not tolerate much more than a 1% magnetic content of the slurry. Special flow meters are made to handle slurries with larger magnetic contents. Proving the accuracy of such gauges is not easy.
- The magnetic flow meter is a velocity gauge by first principles. It can therefore be calibrated to read volume only if the tube is kept full at all times. Entrained air will cause errors proportionate to the volume of slurry it displaces. The cures are similar to that for the density gauge.
- Magnetic flow meter measurements will indicate average liquid velocity i.e. the average of all the velocities across the diameter of the tube (centre tube velocities may be higher than surface velocities). It is only assumed that the solids move at the carrier liquid velocity. This assumption is sometimes erroneous, and may cause large errors in mass flow systems.
The terminal settling velocity of solids increases with both particle size and solids SG increases - the magnetic flow meter will therefore fail to indicate solids velocity correctly to an increasing extent as these two parameters increase (see graph 1). Under these conditions the magnetic flow meter may cause unacceptable mass flow errors and a Doppler flow meter should be considered.
The Doppler Flow Meter: (Doppler shift principle)
The Doppler flow meter in principle determines the velocity of the solids content of a slurry by sending ultrasonic pulses into the slurry line. The frequency at which they are reflected back is a function of the solids velocity, the only important parameter for mass flow measurement purposes. The liquid phase of the flow (water) is not seen by the Doppler flow meter.
- The installation requirements for the Doppler flow meter is similar to that of the magnetic flow meter with respect to a disturbance free straight upward flow and pipe fullness.
- The Doppler flow meter will work equally well where non-conductive carrier liquids are involved, provided that the required minimum percent solids (5%) of a large enough particle size (greater than 100 microns) is carried in the liquid. Too many solids are also problematic and "a slurry SG greater than 1,2 may render a Doppler flow meter ineffective. Any percentage of magnetic particles may be present in the slurry, subject to the minimum and maximum slurry SG and solids particle size.
